A Simple and Effective Way of Technical Analysis on a 15-Minute Chart
A Simple and Effective Way of Technical Analysis on a 15-Minute Chart
By Steve Gomez
It’s not a secret that technical analysis can help traders significantly improve their outcomes. However, there seems to be an overwhelming number of indicators, making it challenging to decide which one to utilize.
This post will outline a practical trick I’ve discovered for technical analysis on a 15-minute chart. Trust me when I say that this method is simple – it only requires two indicators.
So, let’s get going!
Setting Up the Chart
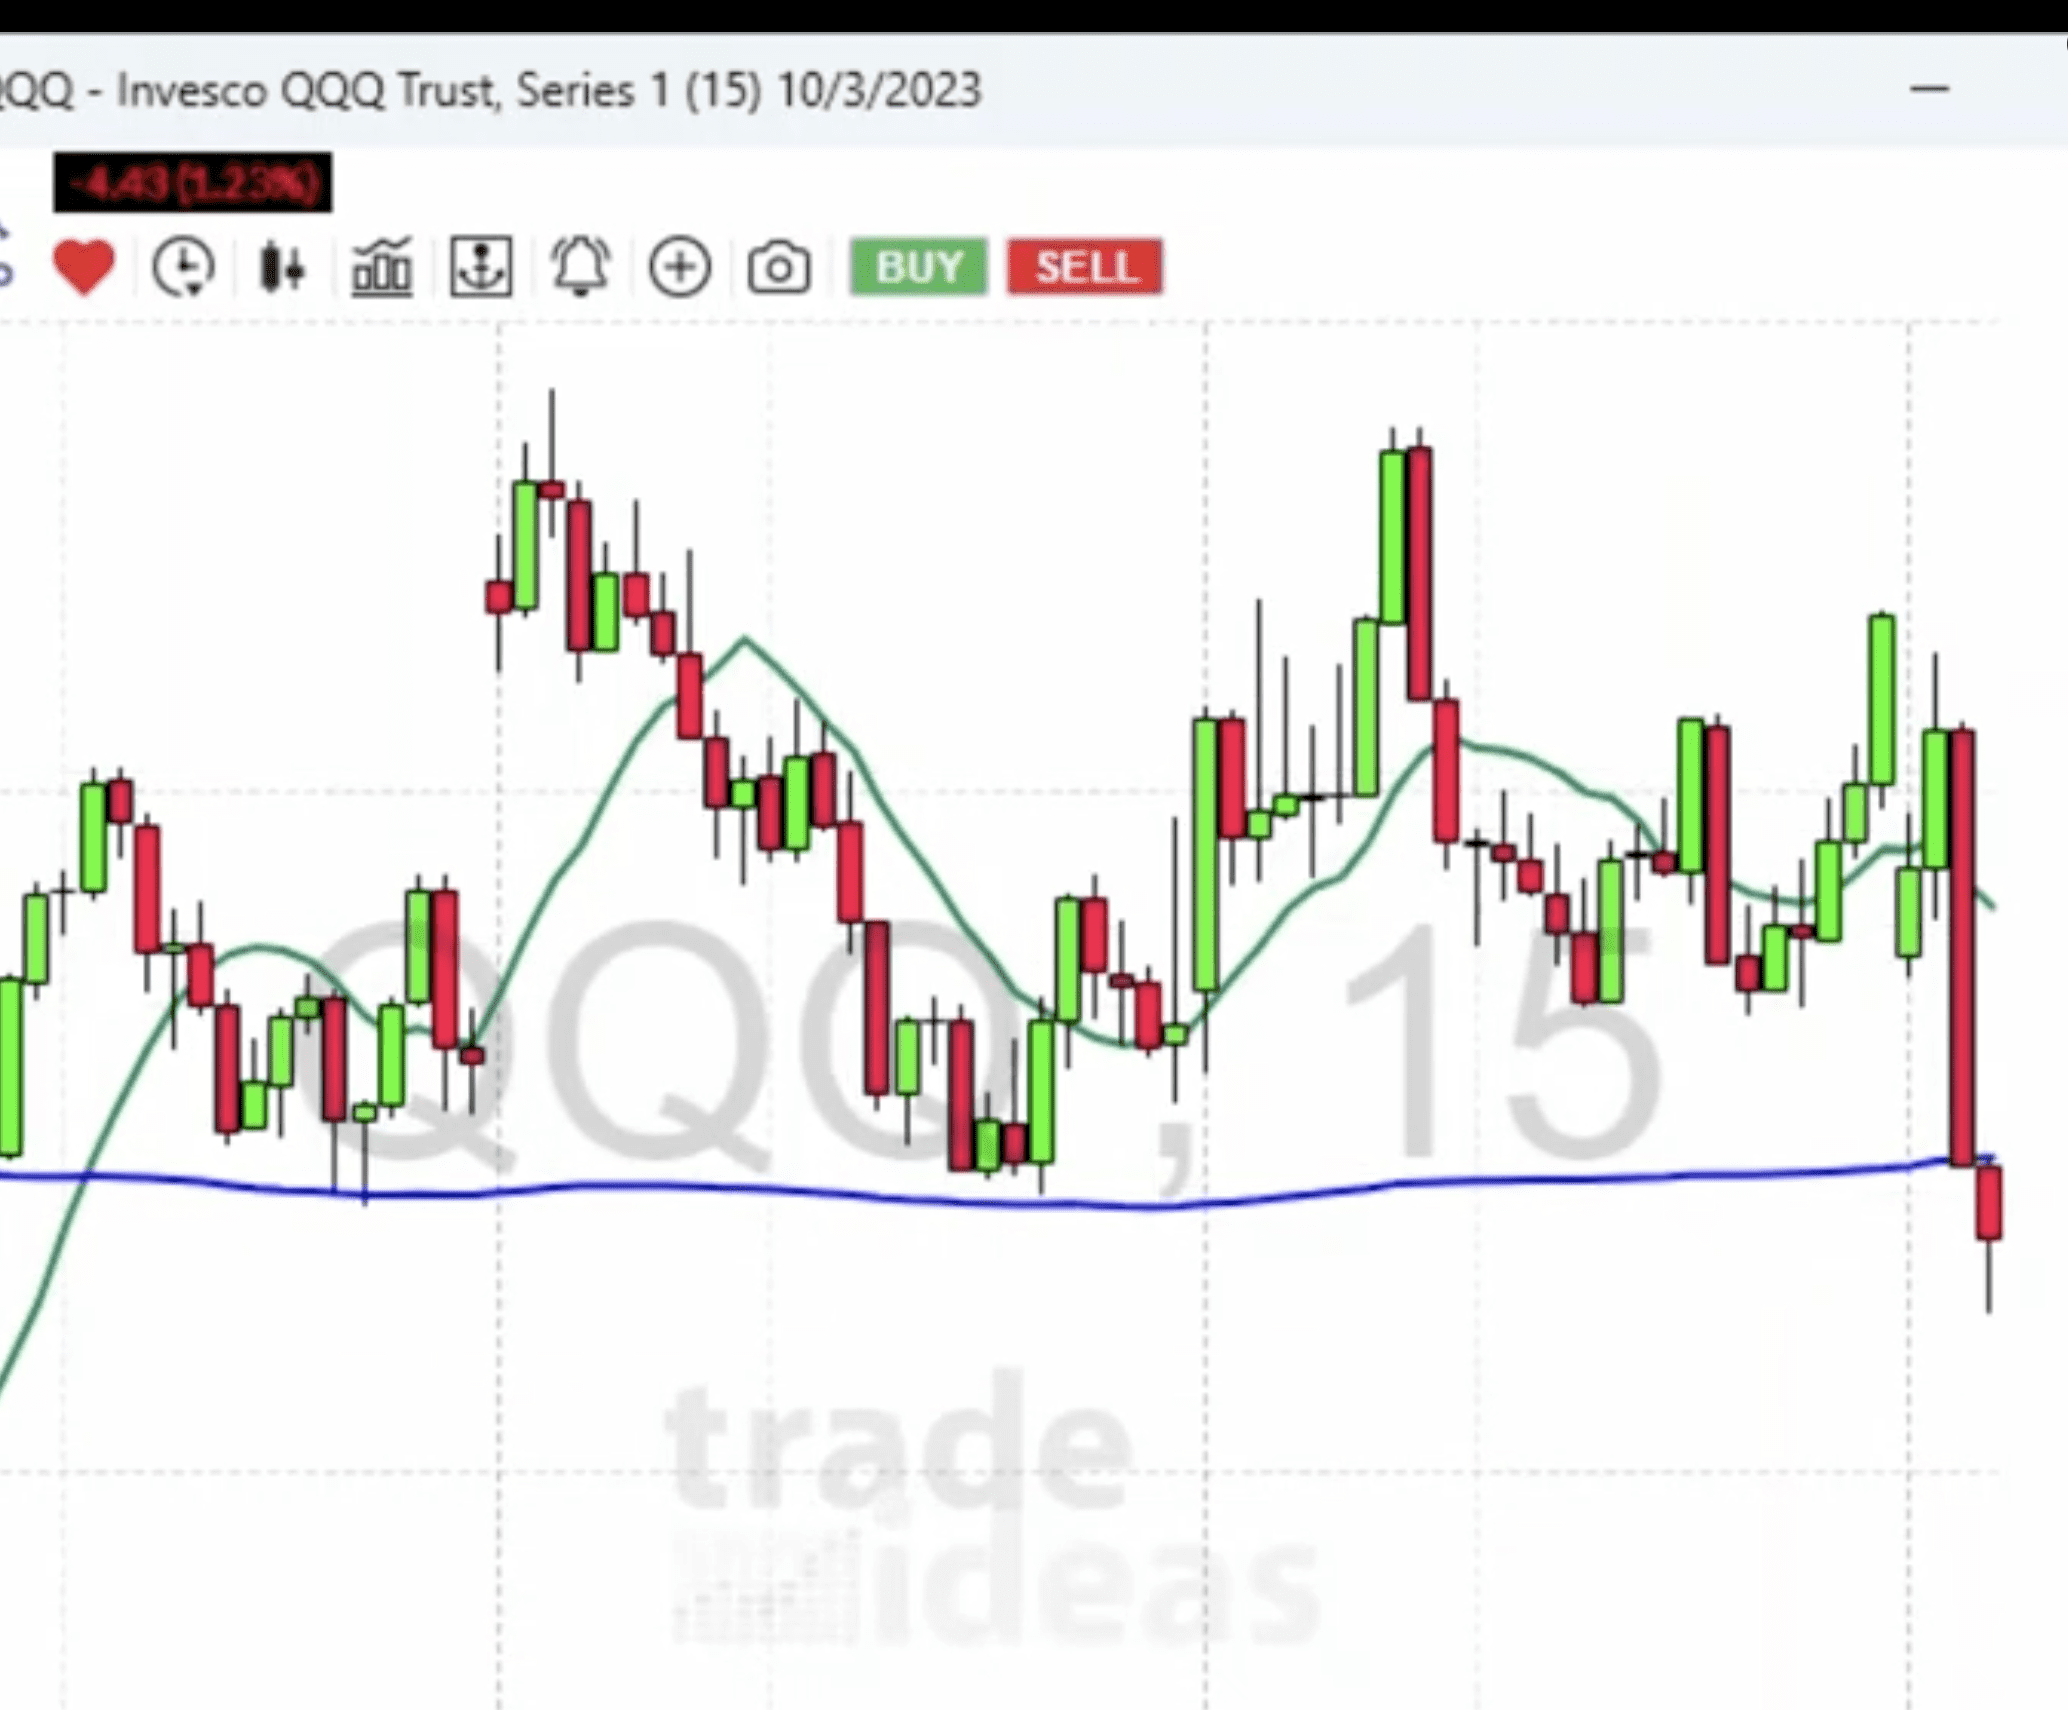
We’re examining the Nasdaq for this demonstration, using two specific indicators: the 5-day and 10-day moving averages. It might come as a surprise, given the chart’s short time frame of 15 minutes. Using this combination, we aim to declutter the daily chart and provide a more straightforward, sleeker view.
Considering an event from a few days ago, if you inspect the blue line, you’ll see it represents support that was broken recently.
This is a perfect example of the 5-day moving average being depicted using a 15-minute chart.
Usage of Moving Averages
The procedure to implement this is relatively simple! Bring a ‘simple moving average’ into the chart and set it to 130 periods.
Why 130 periods exactly, you might ask? Since we’re considering 130 candles over a 15-minute timeframe, this equates to precisely five days.
Here’s the practical application of this theory:
Likewise, the other moving average included here is a ten-period one.
So, you’re now managing two indicators – the five-day and ten-day moving averages – on a 15-minute chart.
The Result and Benefits
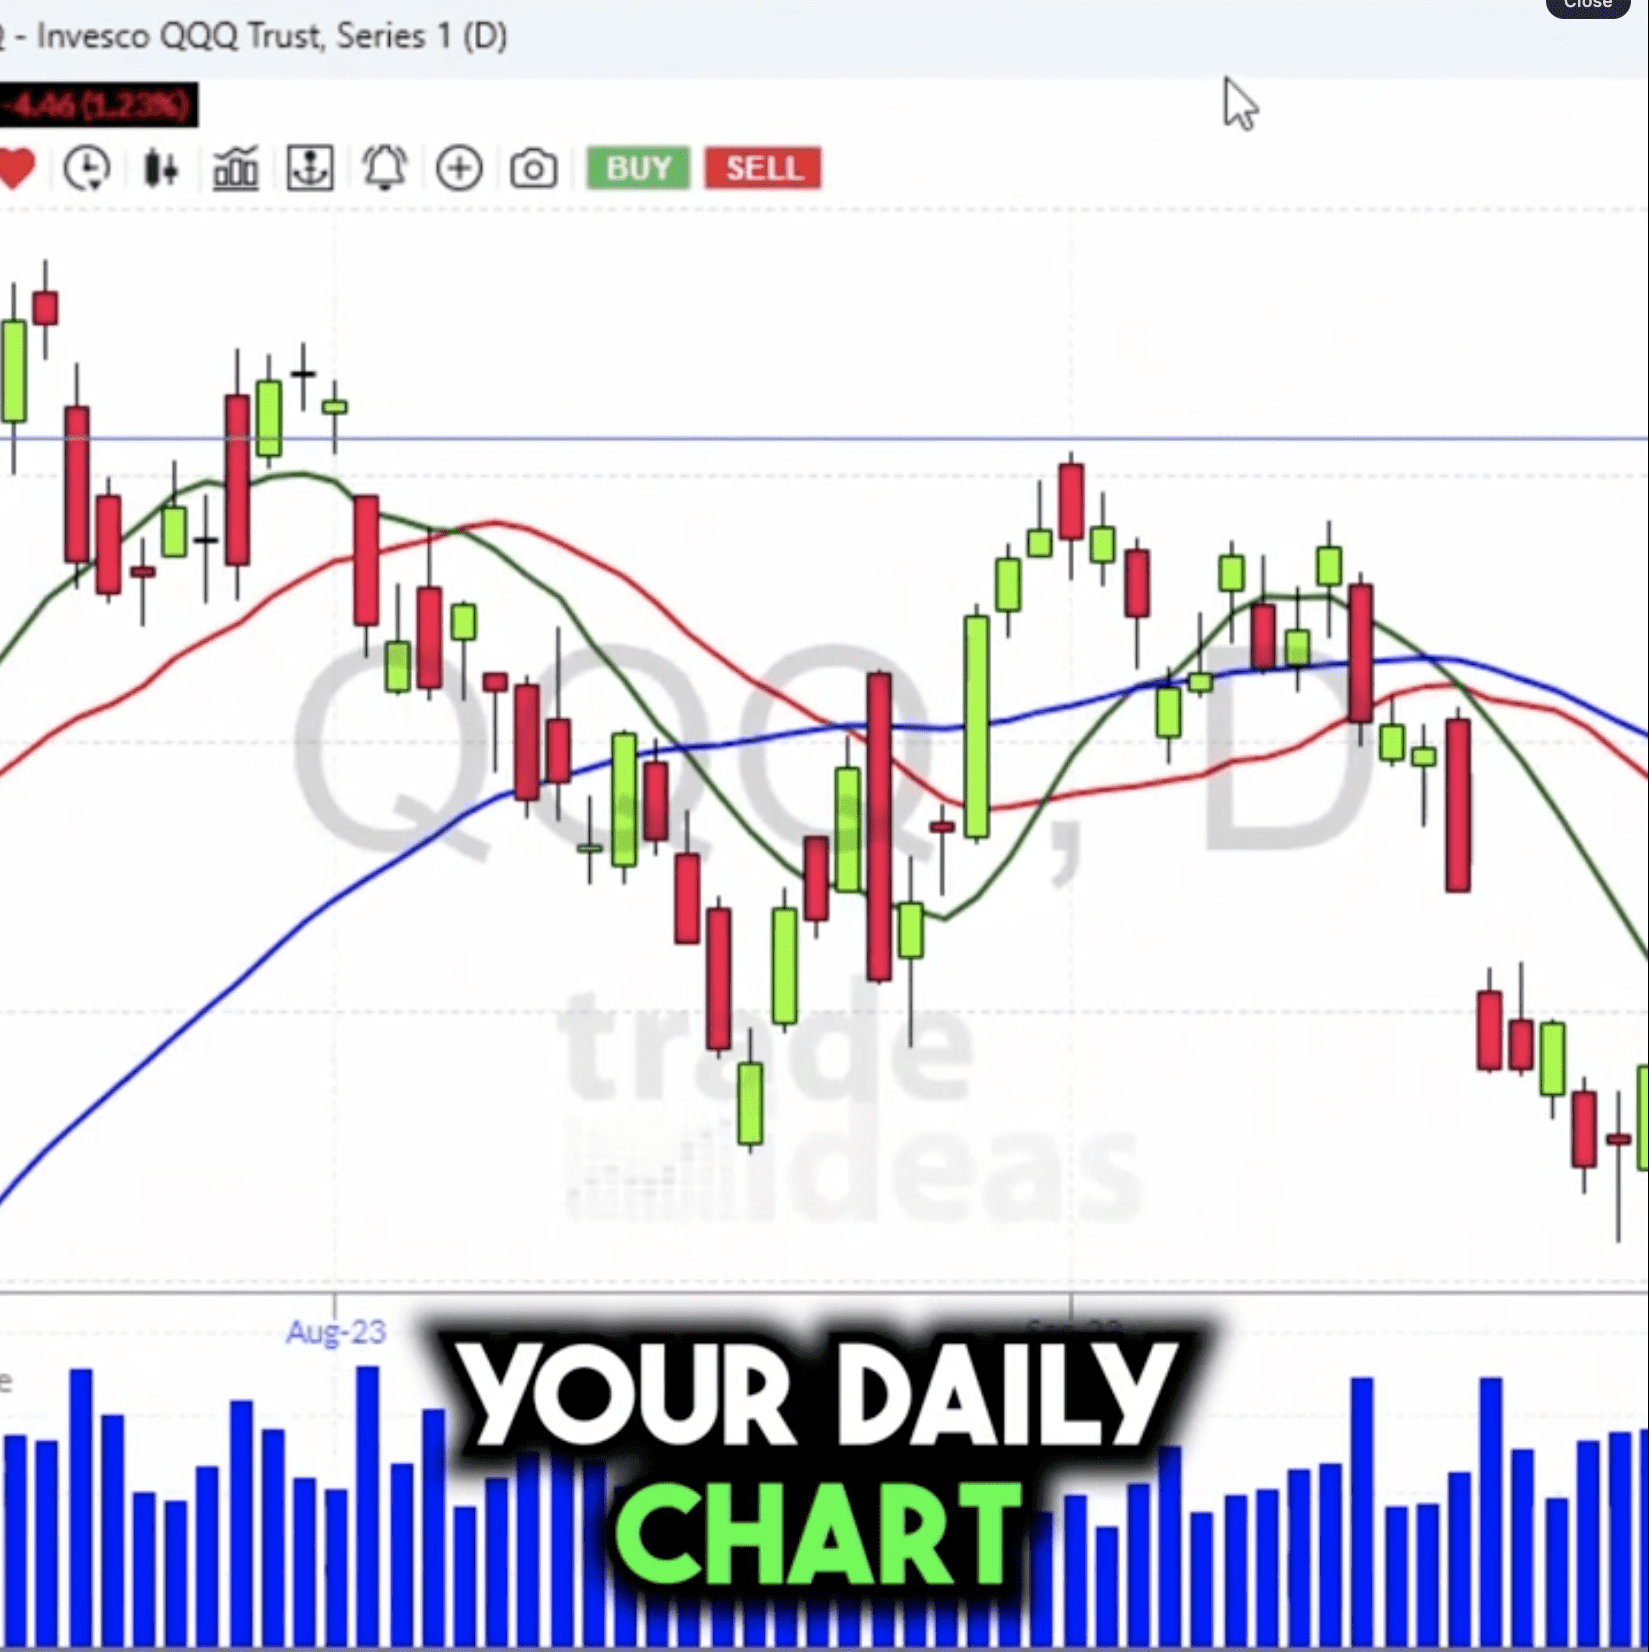
These two indicators tell me everything I need to know about the market at any given time. This strategy’s beauty lies in its simplicity and efficiency, serving as a faster and less complicated alternative to analyzing the daily chart.
“The essence of this strategy is simplicity. Just two indicators provide the necessary information.”
What is essential to remember here is that this trick allows us to analyze a shorter timeframe perfectly and gives an insight into how the market behaves at a micro-level.
In conclusion, the 5-day and 10-day moving averages on a 15-minute chart is a neat, efficient, and uncluttered way to do your technical analysis. It may seem counterintuitive at first to be looking at a 5-day moving average on such a short timeframe chart. Still, once you see the value it provides in terms of instant feedback on whether support levels hold or break, it soon becomes a valuable tool for any trader.
Try this out the next time you’re doing technical analysis, and you might just find it enlightening too!