How Traders Can Use RSI to Discover New Opportunities
How Traders Can Use RSI to Discover New Opportunities
By Katie Gomez
The best traders know never to judge a trade based on first appearances because there is usually more going on underneath the surface, just like an iceberg. When we dig a little deeper, we become exposed to new trends, reversals, and divergences not seen at first glance. Hindsight is 20/20, as we all have trades we look back on with regret for not acting sooner or holding out a little longer if only we knew what would happen. We can’t see the future, but the answers we seek may be found by looking at the past.

Traders constantly overlook opportunities on charts that look stagnant or in a downturn due to a limited, shortsighted vision. We need to look long-term and see what could happen in the future by looking back at what already happened in the past. When we begin utilizing pattern detection, it becomes easier for us to draw more in-depth conclusions before writing off certain stocks or other securities. How do we stop relying on emotions or validating opinions to make our trades? Look at the data in front of you with technical indicators like RSI.
As a trader, RSI pattern detection is one of the closest things traders can get to a crystal ball to adjust their trading strategies accordingly. RSI, or relative strength index, is a commonly used technical indicator for stock trading. RSI and other technical indicators measure the strength and momentum of a stock’s price movement to help us discover potential buying/selling opportunities we usually would’ve looked over.
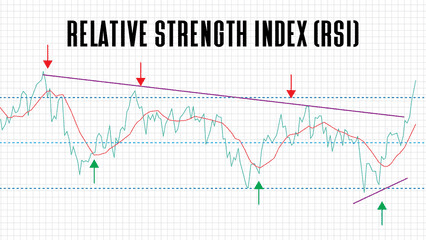
RSI is a momentum oscillator calculated based on the price of a stock over a given period (i.e., 14 days) expressed as a number between 0 and 100. If the given value is above 70, the stock may be overbought and due for a correction, while values under 30 indicate the stock may be oversold. RSI has the power of pattern detection, revealing stocks that may be overbought or oversold (Fernando, 2023).
As traders, we constantly make decisions (buy, sell, or hold). However, many of the best decisions happen away from the herd and take the path others missed. The results of our choices have a lot to do with timing. And if we wait too long for others to catch on, craving validation before making the trade, that window of opportunity closes. Furthermore, a trade is only profitable if the sale and purchase happen at the right time, in those small windows of opportunity.
Although RSI acts as a beneficial tool, it should always be used in conjunction with other technical indicators and fundamental analysis when making trading decisions. Furthermore, no indicator is foolproof in trading, even RSI, so we must conduct our research thoroughly for trades.
Bullish divergence vs. bearish divergence
One of the powerful tools RSI provides, relative to our trades, is spotting pattern changes or divergence. Divergence occurs when the price of an asset starts moving in the opposite direction of the RSI (or other indicator) or is moving contrary to other data. Instances of divergence can easily be missed early on as a fleeting abnormality or a blip on the chart. However, these “blips” act as a warning that the current price trend may be weakening and may even lead to the price changing direction. The goal is to catch it before the price changes so you can manipulate the trade by buying as low as possible or selling before it plummets.

How to spot bearish divergence
Bearish divergence acts as a warning sign that bullish momentum may be weakening. Since the RSI is a momentum oscillator, whenever the price rises, so should the RSI. However, negative or bearish divergence can be spotted when the RSI diverges from the price action (when the price moves up, the RSI fails to follow). When this type of divergence forms, traders must act cautiously and avoid the emotional impulse to react and sell. Instead, you could wait for the price to respond and react downward before selling.
That said, traders should look to RSI to help signal the end of a bull phase instead of trying to time the tip. When the RSI and moving averages signal that the trend is losing momentum, you’ll be more confident that it may be time to cut your losses and sell. In extreme cases, these divergences can also help yield profits on positions before the trend shifts (Upadhyay, 2021).
How to spot bullish divergence
Bullish or positive divergence occurs when prices fall to a new low while the RSI also fails to reach a new low, often signaling the end of a downtrend, reinstating the reigning power of the bulls back in the market. If you have identified a lower low in the price chart and a higher low in the corresponding indicator, you have spotted a bullish divergence. Again, correlation does not equal causation, as divergence is not a foolproof indicator and should be used in addition to other analysis and risk management strategies.
Summing up, every moment matters as a trader, so we must keep our eyes peeled and ready to act, as these windows of opportunity are more fleeting than we think. There isn’t always time to mull these things over, so instead of wasting it asking for validation, turn to indicators like RSI to give you the objective truth. Even if it turns out to be a mistake, it is still a win because we learn through action, not observation. The more you put yourself out there and use your tools to make decisions, the less dependent you become on the feedback of other traders. You change from a follower to a leader. So, look a little deeper, find new patterns, avoid making snap judgments, and see the potential profit awaiting you once you leave your bubble.
It is easy to follow the herd because trading without the support and reassurance from other traders feels risky and unsettling. However, thinking about how many opportunities were missed because most traders overlooked them is even more unsettling, and should make you want to double-check charts in the future. Just as you wouldn’t judge a book by its cover, don’t judge a stock by your first glance at the chart; there is always more than what meets the eye. Try out RSI today and never miss a thing by subscribing to Trade Ideas.
References