Golden Cross vs. Death Cross
Golden Cross vs. Death Cross
Written by Katie Gomez
The world of stock trading is expanding, and the indicators available to help traders are developing with it. If you want a chance at increasing profits in the market, you need to work smarter. When you know what is happening in the world, you can better stay on top of your investments. The best stock traders know where to look for advance research so they can act before news hits wide press distribution (at which point it may already be too late).
The Golden Cross and Death Cross are popular indicators with traders. Without tools and indicators, we feel less in control and left in the dark. The more support and safety you can feel with your trades, the better. Cross indicators are especially relevant because cross indicators identify when the market is trending downward or upward.
Whether you are a new trader or an experienced one, the ability to identify chart patterns will help you better understand how stocks work. I will review some essential indicators to help you navigate this challenging market time and ensure your current investment portfolio remains protected.
The Golden Cross
The Golden Cross is a valuable indicator that consists of three stages. Stage 1 requires a downtrending stock price. The next stage shows a short-term moving average cross over a long-term, eventually triggering a breakout and trend reversal. The final stage, dependent on the results of the first two, continues the uptrend and marks the rise of stock prices. Overall, the Golden Cross stock pattern can identify a potential uptrend or future upswing in the stock market.
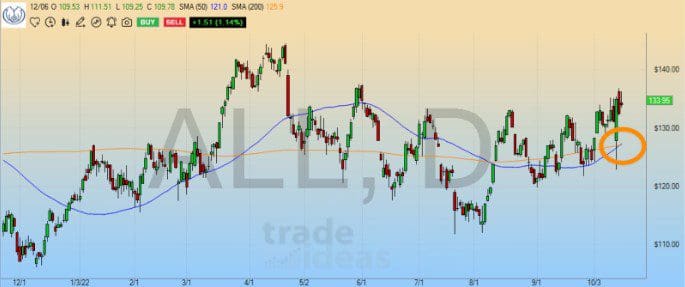
You can identify the Golden Cross on a chart by looking at the moving averages. The Golden Cross is known as an output measurement or lagging indicator, comparing prices and measuring change across moving averages. The most popular moving averages used are the 50-day and 200-day moving averages. Since it is usually associated with an uptrend in the market, the Golden Cross is said to occur when the short-term moving average of a stock (50-day) trades above its long-term (200-day).
Although the Golden Cross pattern cannot guarantee the future of a stock, it has the potential to alert traders that a long-term bull market might be happening on the horizon. Whether the stock market is bullish or bearish, longer moving averages tend to be more reliable as they exemplify stronger market signals, which brings us to our next indicator: The Death Cross.
The Death Cross
If you couldn’t gather from their polarizing names, the Death Cross is the opposite of the Golden Cross. Since the Golden Cross pattern recognizes a long-term bull market, the Death Cross signals a long-term bear market. The memorably named Death Cross indicates a downturn in the market, compared to the Golden Cross. Conversely, the Death Cross finds the short-term moving average trading below the long-term moving average.
A crossover occurs in both cases: the Golden Cross sees the long-term moving average as a support level, while the Death Cross is considered a resistance level. Therefore, whatever crossover occurs could indicate a significant shift in the bull or bear market. Additionally, it is essential to note that crossovers can produce more reliable and effective results with a high trading volume.
It would be best to remember that all indicators have limitations, even ones with seemingly imminent names, such as Golden and Death Cross. Traders can’t rely solely on signals and indicators because they can regularly fail. For this reason, traders must always use other tools and resources in addition to the crosses to confirm predictions.
There is no reason that traders should trade alone. Seeking financial advice or joining a community like a trading room are also great ways to help confirm predictions identified by specific indicators. Whether you feel bullish or bearish, community feedback can help to improve your skills by exposing you to new tools and education resources.
Given how the market is currently performing, investing is one of the best ways to beat inflation. And it never hurts to improve your skills and approach. If you want to up your trading game, Trade-Ideas can set you up with all of the above. Visit trade-ideas.com to learn more.
References
Hayes, A. (2022, August 29). Golden Cross Pattern explained with examples and charts. Investopedia. Retrieved November 16, 2022, from https://www.investopedia.com/terms/g/goldencross.asp#:~:text=Key%20Takeaways,indicating%20a%20bearish%20price%20movement
(2022, September 22). Golden Cross Stock Pattern: How To Find & Trade as smart investors. Public. Retrieved November 16, 2022, from https://public.com/learn/golden-cross#:~:text=Stage%201%20shows%20a%20stock,uptrend%20as%20stock%20prices%20rise.