The Hindenburg Omen
The Hindenburg Omen
Nov 21, 2022
Written by Katie Gomez
Successful stock traders are known for logic-based decisions, impeccable timing, and critical thinking. So when someone mentions an “omen,” you may be surprised. However, the “Hindenburg omen” is far from superstition or spiritual fallacy. Instead, it is a technical indicator designed to signal the increased probability of a stock market crash. Given the impending nature of the down-trending market we are currently experiencing, this omen/indicator might help offer options for your current or future trades. In this blog article, I will review the origin of the Hindenburg omen, explain the main criteria that signal its presence, and leave you with its critiques and success rate.
What is the Hindenburg Omen?
When we hear the word omen, it rarely indicates something exciting or beneficial is waiting on the horizon; it is usually a warning or indication that something terrible is looming. This “omen” is a technical indicator initially designed to inform traders when the end is near and indicate when to jump ship before their investments plummet along with the market. The Hindenburg omen is not simply a prediction that a bearish downtrend may occur, it signals a market plummeting.
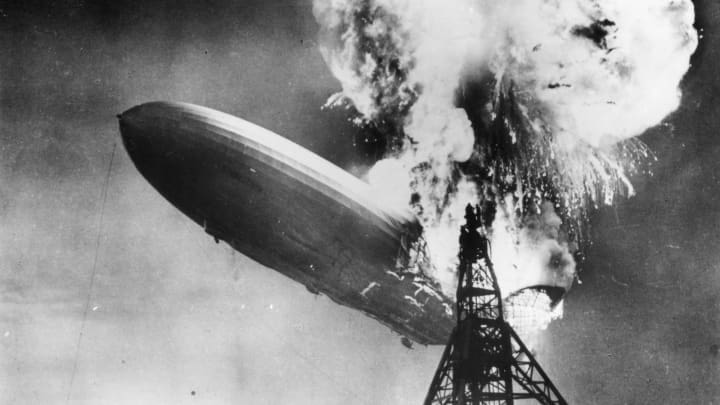
James R. Meikka coined the indicator term the Hindenburg Omen following the German Hindenburg aircraft disaster of May 6, 1937. The Hindenburg airship had embodied the essence of hope and innovation, potentially creating a better future for humanity, until it crashed. Meikka found it fitting (in a dark humor sort of way) to use its memory as a metaphor later to describe a stock market crash prediction.

What does the Hindenburg Omen indicate?
The various technical indicators can divide into four categories: volume, volatility, momentum, and trend. However, the Hindenburg Omen is a rarity in the world of trading because it encompasses all four major categories; it indicates a result of market decline caused by breadth divergences (Ganti, 2022).
Breadth divergences occur when a few big-name stocks overshadow the market, concealing the bearish nature of the rest that make up the index. This concept reflects the changes in highs and lows exemplified in a 52-week index; when there are many highs and lows, it indicates a potential turning point in its rally (CFI team, 2022). The omen keeps track of these overshadowed stocks and looks for statistical deviations in the index since these traits often lead to a bear market and potential crash.
Criteria and conditions for the Hindenburg Omen
- The daily number of highs & lows for a 52-week market index is more significant than the typical threshold amount (2.2 to 2.8%).
- The 52-week highs must be at most 2x the value of the 52-week lows.
- The Mclellan Oscillator (MCO), or the measured value of market sentiment shift, is negative.
- The stock market is currently in an uptrend (indicated by a 10-week moving average)
- The Benchmark index for the exchange must be greater than its previous value from 50 days ago.
How do traders react to the Hindenburg Omen?
Given the conditions mentioned above, the reactions from traders can vary. One familiar reaction traders have from a negative MCO. When traders see the MCO is negative, they usually hesitate to exit the market, refrain from buying stocks, and even short the market. However, it would be best if you did not falsely assume the conditions of the Hindenburg omen to be the acceleration for a stock market crash or recession.
Criticisms of the Hindenburg Omen
Despite the name indicating impending doom on the financial market, it is not the most reliable or valid source, with a low success rate of 25%. Unfortunately, the Hindenburg omen has provided skewed data, false signals, and even an outside effect/bias. Although it has proven its worth over the years, like all indicators, it has its faults, so traders should always confirm its market predictions by other sources and data. You can find more examples of indicators used for additional confirmation in my previous blogs at www.trade-ideas.com/blog.
REFERENCES
CFI Team. (2022, October 19). Hindenburg omen. Corporate Finance Institute. Retrieved November 16, 2022, from https://corporatefinanceinstitute.com/resources/equities/hindenburg-omen/
Ganti, A. (2022, February 8). The hindenburg omen. Investopedia. Retrieved November 14, 2022, from https://www.investopedia.com/terms/h/hindenburgomen.asp
