Pivot Points, Support, and Resistance
Pivot Points, Support, and Resistance
Written by Katie Gomez
The more you know, the more power you have as a stock trader. There is a world of information that can help you become a better trader, and indicators are a great place to start. Understanding the difference between indicators like support and resistance is an example of simple but vital information for researching and finding buyers and sellers.
Support vs. Resistance
Support is where you can expect to find buyers, while resistance is where you can expect sellers. Although there are many ways to try and identify these on your own, there are already existing indicators. These indicators show you the pivot line (also known as P1), a line that any experienced trader knows. This line can move up or down, but the first thing it will inevitably run into is Resistance 1 (or R1). R1 allows traders to predict future seller possibilities to time the right trades. R1 is a simple calculation. Looking at the closing candles of the stocks above R1 shows where the seller’s most reasonable price level will come in (resistance). “The most effective way to apply support and resistance is to monitor for breakdowns (stock falls below support) and breakout (stock rises above resistance).”
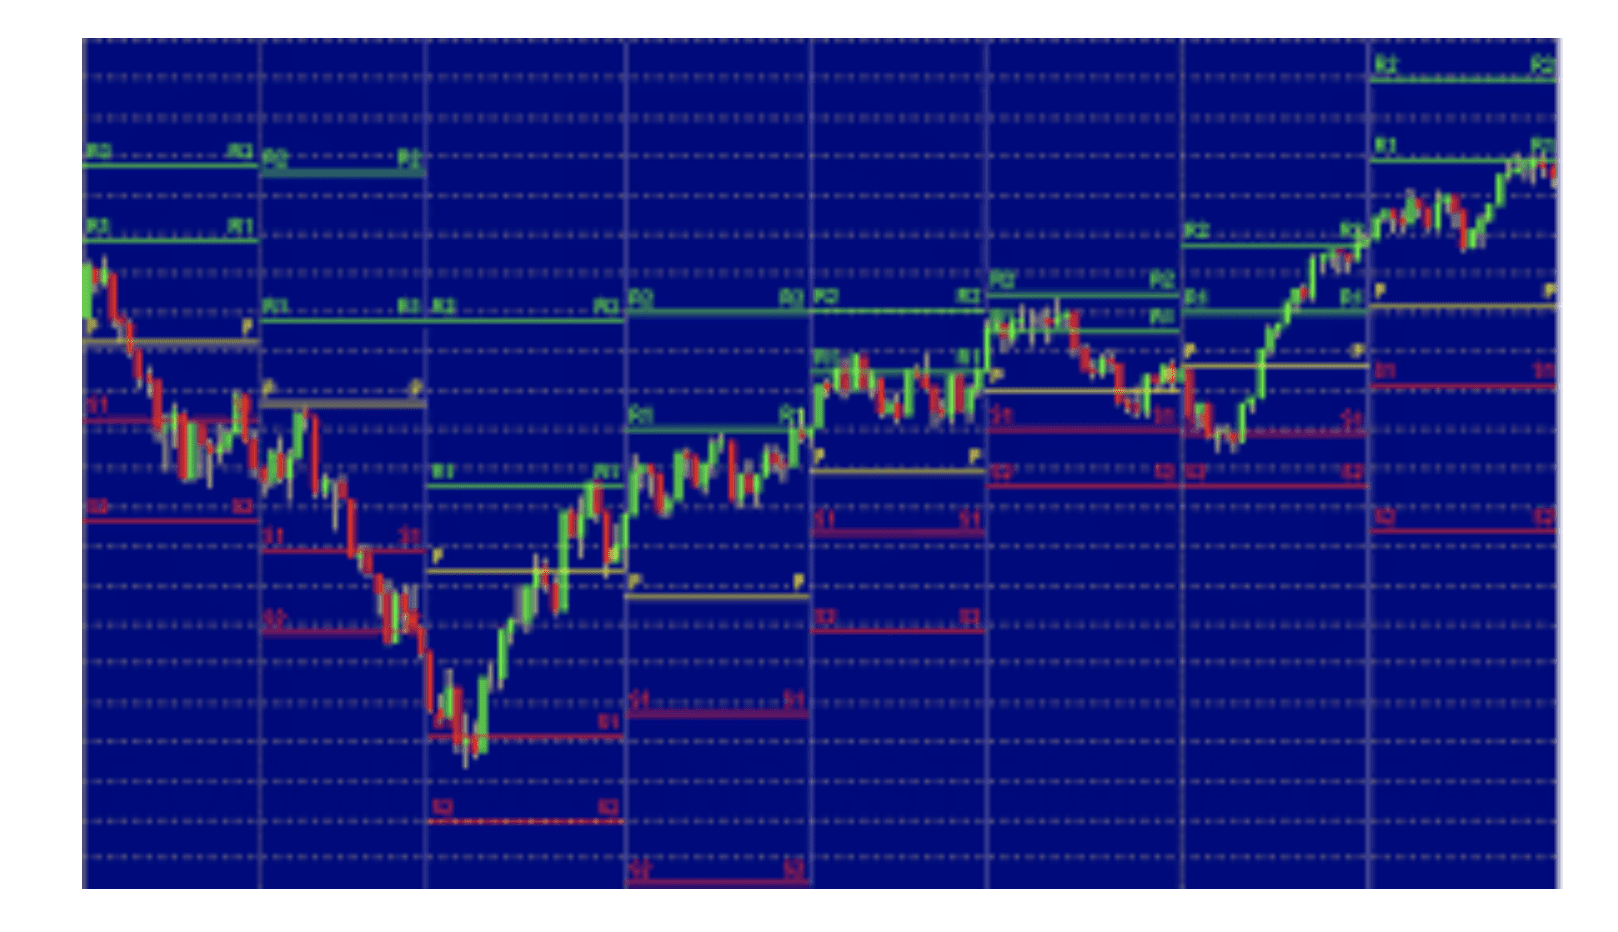
The pivot point is the next piece of the puzzle needed to utilize support and resistance. “Pivot points refer to a technical indicator that allows traders to identify potential support and resistance price levels in a securities market” (CFI TEAM, 2022).
When calculating pivot points, the point merely acts as the primary level of either support or resistance; it is the equilibrium price. Therefore, traders try carefully to avoid breaking the pivot. The pivot point equation is: previous high + previous low + previous close ÷ 3.
Equation Break-Down
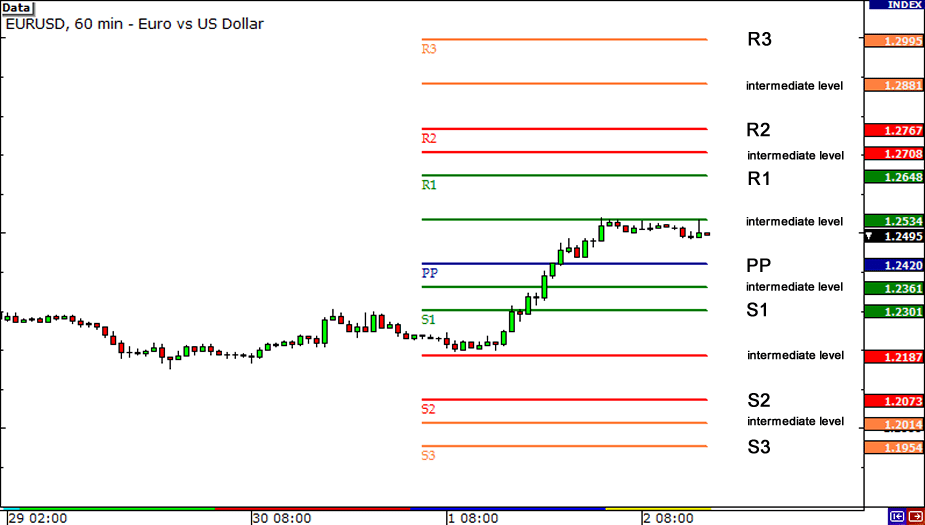
Looking at the equation above, we can see that previous high, low, and close prices can all be solved by finding the support and resistance variables (R1, R2, S1, S2). Once the P line moves past Resistance 1 or R1, it will meet the next level of resistance, R2, which is the secondary backstop. Below the pivot is S1 or support level 1, and past that level, you’ll find S2. Essentially, traders solve a basic five-point mathematical equation using the stock’s previous data to help find the current area of interest. Here is the system used to solve the equation.
S1= (P x 2) – Previous High
S2= P – (P x 2) – Previous High
R1= (P x 2) – Previous Low
R2= P + (Previous High – Previous Low)
Applying Support and Resistance
Once you become familiar with calculating the pivot point P, you can begin to follow where it moves. The price action tends to bounce around the pivot point (P line of equilibrium), so all traders have to do is follow the direction of the bounce. For instance, you should buy long if you find a trade price that hovers above the P line and bounces back up. On the other hand, if the price point hits below the pivot and bounces back down, that could indicate the need to sell short.
Are Pivot Points Helpful?
Pivot points can be helpful for any trader to determine market trends and understand when exactly to and exit the market; specifically, day traders find pivot points extremely useful. Day traders are pivot point fans because they don’t have much time to spare during the workday due to the focus and alertness needed to maintain their trades. That said, pivot points are a valuable tool given their high accuracy, short time frames, and easy to use methods. However, as with all indicators, confirming the pivot signals with other aspects of technical analysis is always a good idea. Pivot points are not guaranteed to help your trades; as with all indicators, use whatever works for you and leave whatever doesn’t.
In conclusion, if these indicators do not make sense or don’t work for you, don’t worry. These indicators are just points on a chart; you can take them or leave them and still be a successful trader. Taking the time and learning more about support and resistance can only benefit you in the long run. Although these variables do not have the power to tell us exactly what a stock will do, they narrow our focus by pointing out specific areas of interest; they let us know which stocks we should watch closely.
REFERENCES
CPF Team. (2022, October 25). Pivot points. Corporate Finance Institute. Retrieved November 9, 2022, from https://corporatefinanceinstitute.com/resources/wealth-management/pivot-points/
What are pivot points? Fidelity. (2022). Retrieved November 9, 2022, from https://www.fidelity.com/learning-center/trading-investing/technical-analysis/technical-indicator-guide/pivot-points-resistance-support#:~:text=Pivot%20Points%20(Resistance%20and%20Support)&text=Pivots%20Points%20are%20price%20levels,Point%20for%20the%20current%20day.
E-Trade Securities. (2019, February 28). Technical analysis: Support and resistance: Learn more. Technical Analysis: Support and Resistance | Learn more. Retrieved November 9, 2022, from https://us.etrade.com/knowledge/library/stocks/understanding-support-resistance