Turn on Your Heartlight
Turn on Your Heartlight
Apr 28, 2014
The heartbeat alert is one of the most poorly understood alerts at Trade-Ideas. But it can be very useful. Just this morning I wanted to look at some filters to see how they changed over time. This happens a lot. This is a perfect reason to use the heartbeat alerts.
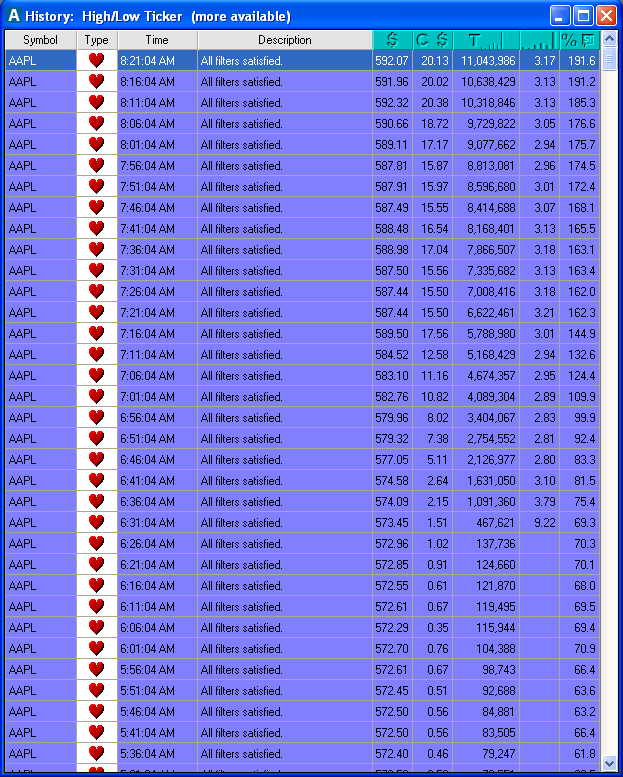
I wanted to check out one of our social activity filters. This is the screen I was looking at. This compares the social activity to the relative volume for Apple this morning.
Here I can see a history of various stock market data for Apple this morning. This is useful when you want to understand our filters. This is how you know the filters are doing what you think they are doing.
I can quickly see that there is already almost twice as much social volume for Apple as on a normal day. And I can see that Apple has traded 3x as many shares as normal of this time of morning. My goal this morning was to make sure that the social filter was working right. So it’s good to see a lot of data, not just a single alert. By seeing this entire window I can get a better feel for what’s going on.
At this point I was done with my task. But this is such a powerful tool, so let’s take a closer look. What do you notice?
One thing that should be obvious is that the relative volume column is blank before 6:30am. (I’m in California. This would show up as 9:30 am if I was in New York.) So you can quickly see that the relative volume filter is not available before the market opens. This is a common mistake people make. If you set a minimum value for this filter, you won’t see pre market data. Maybe you read that in our help, but you forgot. Seeing this should remind you.
You can also see that our social activity filter (like our normal volume filter) is constantly going up over time. Our relative volume filter is different; it adjust for the current time of day. So you can see that, while Apple has high volume today, it is consistently high. There wasn’t one big spike. People have been trading a lot of Apple all morning long. It might look like there was a spike at 6:31:04 this morning, but you can’t take that too seriously. With only 64 seconds worth of data, you can’t do a meaningful average. (That’s why we don’t even try to compute this filter before the market opens. There would not be enough data for a meaningful result.)
When you ask Trade-Ideas Support for help, this is often how we find the answer. People give us a complicated strategy and ask why it didn’t work as expected. We start by looking at all of the filter values. Let me show you how I got to this window, so next time you can do it yourself.
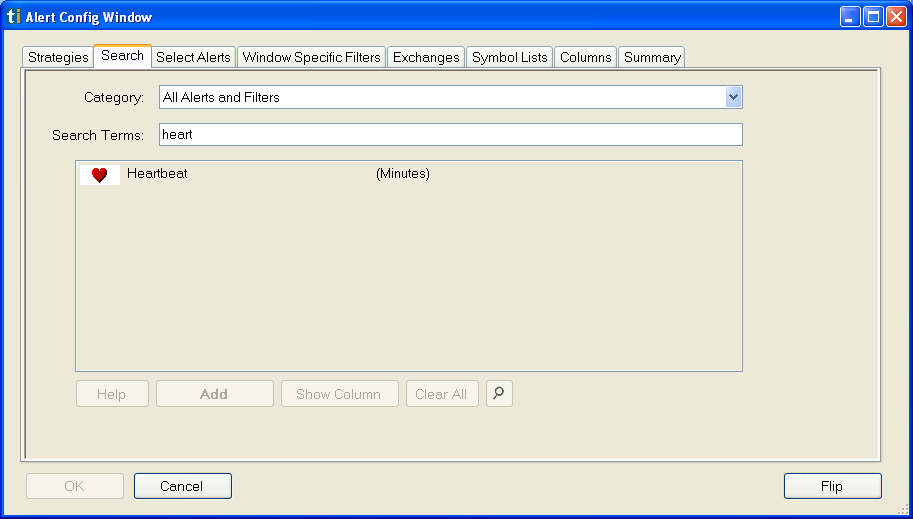
I already had an alert window open, so I brought up the config window. I knew I wanted the heartbeat alerts, so I immediately went to the search tab and typed “heart”.
I clicked on that alert and selected “Add”. That took be to the alerts tab, where I unchecked all of the other alert types.
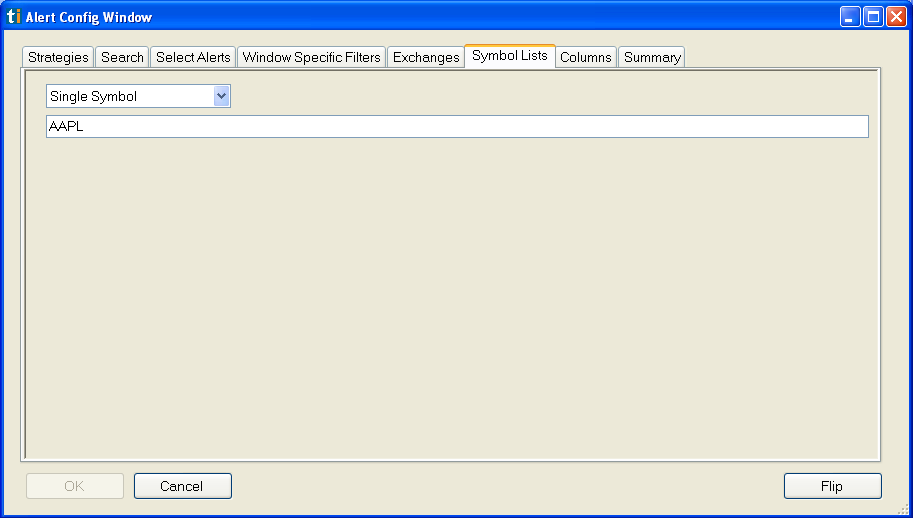
I wanted to see how the social activity was changing over the day, so I thought it was best to focus on one stock. That way I could see a trend. So I selected “Single Symbol” and typed “AAPL”.
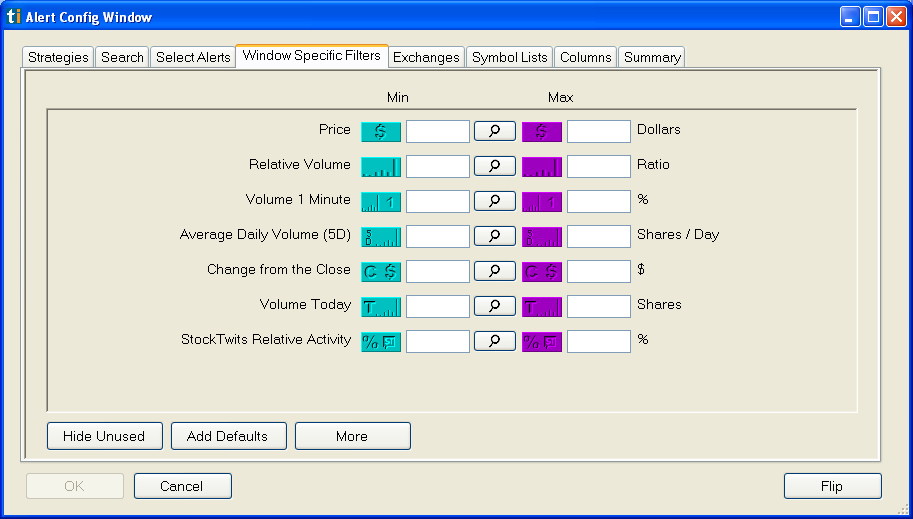
Next, I got rid of all of my other filters. Clearing all of the text fields in this tab means to show me as much data as possible.
The filters might be the most important thing we offer. Most real strategies would have a lot of filters. But I know that I want to see this one stock, and I want to see it all day long. So in this case the other filters would have only gotten in the way.
Finally, I added the filter that I wanted to look at. I went back to the search tab and typed “social”. At this time Trade-Ideas showed me three relevant alerts and filters.
I selected the last one. That gives me a lot of current information for each stock. The filter in the middle tells you the average social activity. It does not change during the day. If I displayed that with the heartbeats, the results would not be very interesting. After selecting “StockTwits Relative Activity”, I clicked “Show Column”.
I left the other settings alone. That’s why I had several more columns. That’s also why I have a bad name at the top of the window. (Oops!) I hit “OK” and got the window that I showed you at the top of the article.
I hope this this article gives you some insight into our process here at Trade-Ideas. We are happy to give you a strategy or help you fix your own strategy. But you have access to most of the tools and data that we do. You can do this yourself. It might take a little longer at first, but this way you will really understand the tool, and then you can get the most out of the tool.


