Here’s How to Trade Long on % Down Stocks: Traders’ Tips
Here’s How to Trade Long on % Down Stocks: Traders’ Tips
Apr 29, 2009
TRADERS’ TIPS: TAS&C May Issue
“He was utterly fearless but never reckless. He could, and did, turn on a twinkling if he found he was wrong.” — Jessie Livermore, American author, investor
In this month’s issue of Technical Analysis of Stocks & Commodities in the Traders’ Tips section, Sylvain Vervoort offers an analysis of trailing stop methods (specifically the Fixed-Percentage Trailing Stop) on a portfolio of 25 stocks for a backtest period ranging from 01/16/2003 until 11/10/2008. Subscribers to Trade-Ideas PRO who use our event-based backtesting tool, The OddsMaker, already understand the different premise these tools use to find high probability winning trades.
To recap briefly The OddsMaker doesn’t just look at 25 stocks, à priori, to generate backtest results, it considers any stock that matched a desired pattern in the market, finds that stock, and applies the backtest’s rule set before summing up the results into a detailed set of totals: win rate, average winner, average loser, net winnings, and confidence factor.
See Figure 3.
As such we provide an alternative stop method for your consideration.
The Wiggle
At Trade Ideas we use a custom stop that takes into the account a stock’s 15 minute average volatility multiplied by the relative volume (an indexed ratio of what the current volume is over its historical volume of the stock at the time a trade is made). This measure is called the wiggle.
The wiggle can be further explained with an example of the stock NFLX. NFLX’s 15 minute average volatility is $0.3306 / 15 minutes (a running 30-day average of 15-minute values). If the relative volume of NFLX at the time of an alert is 1.5 (i.e., trading at 50% above what it normally trades at this time of the day of the alert based on accumulated volume of the day)
, then the wiggle is $0.50 (i.e., $0.3306 * 1.5). Look up the volatility values of any stock at the
Trade-Ideas.com Stock Research section. Imagine using a $0.50 stop and attempting to stay in a GS short or long, chances are, you are right on the trade but get stopped out only to watch the stock do exactly what you thought it would – painful. The wiggle creates a customized stop out that takes into account the certain characteristics of each stock.
The wiggle is used in the following strategy, “Long on % Down Stocks” and is based on the Trade-Ideas inventory of alerts and filters found in our flagship product, Trade-Ideas PRO. The trading rules are modeled and backtested in its add-on tool, The OddsMaker.
Description: “Long on % Down Stocks”
Provided by:
Trade Ideas (copyright © Trade Ideas LLC 2009). All rights reserved. For educational purposes only. Remember these are sketches meant to give an idea how to model a trading plan. Trade-Ideas.com and all individuals affiliated with this site assume no responsibilities for trading and investment results.
Type or copy/paste this shortened string directly into a browser then copy/paste the full length link into Trade-Ideas PRO using the “Collaborate” feature (right-click in any strategy window):
http://bit.ly/1WrpZ (case sensitive)
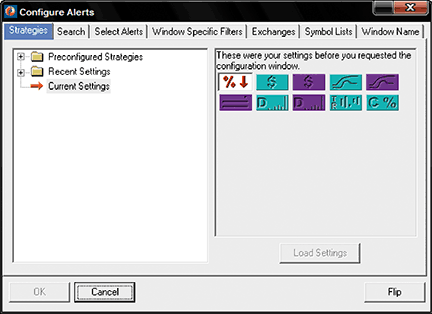
You can also build the strategy from Figure 1 below.
Figure 1 below shows the configuration of this strategy:

Where 1 alert and 9 filters are used with the following settings:
- % down for the day, 3 %
- Min Price Filter = 5 ($)
- Max Price Filter = 40 ($)
- Min Spread = 10 (pennies)
- Max Spread = 150 (pennies)
- Max Distance from Inside Market Filter = 0.01 (%)
- Min Daily Volume Filter = 50,000 (shares/day)
- Max Daily Volume Filter = 2,000,000 (shares/day)
- Min Today’s Range = 55 %
- Min Up from Close = – 10 %
The definitions of these indicators appear here: https://trade-ideas.54solutions.com/Help.html.
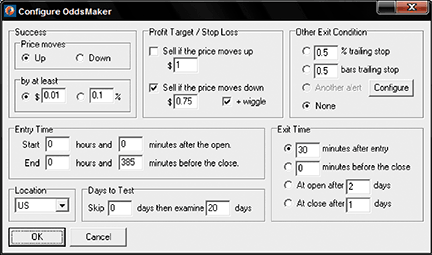
That’s the strategy, but what about the trading rules? How should the opportunities that the strategy finds be traded? Here is what The OddsMaker tested for the past 4 weeks ending 3/16/2009 given the following trade rules:
- On each alert, buy long the symbol (price moves up to be a successful trade)
- Schedule an exit for the stocks 30 minutes after entry
- Start trading from the open and stop trading 5 minutes later (or 385 minutes before market close)
- Set a stop at $0.75 + the value of each stock’s wiggle
The OddsMaker summary provides the evidence of how well this strategy and our trading rules did. The settings are shown here in Figure 2.

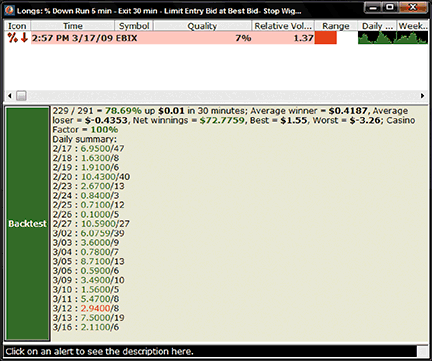
The results (last backtested for the 4-week period ending 03/16/2009) are as follows:

The summary reads as follows:
This strategy generated 291 trades of which 229 were profitable for a win rate of 78.69%. The average winning trade generated $0.42 in profit and the average loser lost $0.44. The net winnings of using this strategy for 20 trading days generated $72.78 points. If you normally trade in 100 share lots, this strategy would have generated $7278. The z-score or confidence factor that the next set of results will fall within this strategy’s average winner and loser is 100%.
Understand these backtest results from The OddsMaker in more detail by reading the User’s Manual: https://trade-ideas.54solutions.com/OddsMaker/Help.html
Related Articles
Previous Trader’s Tips articles


