Zag vs Zig on Relative Strength & This Stock Pattern Strategy Will Reward You
Zag vs Zig on Relative Strength & This Stock Pattern Strategy Will Reward You
Mar 23, 2009
Below is the original Trader’s Tips article submitted for the just released April issue of Technical Analysis of Stocks & Commodities
TRADERS’ TIPS
April Issue
“Your emotions are often a reverse indicator of what you ought to be doing.” John F. Hindelong
For this month’s Traders’ Tips, we offer a stock trading strategy based, in part, on the High Relative Strength ideas proffered by Gerald Gardner. Specifically we show two tendencies in this current market:
- Look just beyond the short term when using Relative Strength (i.e., holding opportunities for at least a day)
- Fade those stocks that display strong Relative Strength – in this market the odds tell us it just pays to do so
15 Minutes can tell you a whole lot about the rest of the day. When finding stocks with a very high 15 minute Relative Strength Index reading of 80 or more, one would assume that strength suggests the uptrend will continue. Not so says the OddsMaker, Trade-Ideas’ “Event-Based” back testing system.
You can use Relative Strength in stocks to profit, just fade the trade.
Hold the short position for one day and look at the results we generated below. The strategy is based of course on the Trade-Ideas inventory of alerts and filters found in our flagship product, Trade-Ideas PRO. The trading rules are modeled and backtested in its add-on tool, The OddsMaker.
Here is the strategy to profit from High Relative Strength in stocks:
Let’s define terms first. Here is the Trade-Ideas Online Help explanation of the Relative Strength filter:
“This filter refers to Wilder’s Relative Strength Index (RSI), using the standard value of 14 periods. The server recomputes this value every 15 minutes, at the same time as new bars or candlesticks would appear on a 15 minute stock chart.This filter does not use pre- or post-market data. This filter is only available for stocks with sufficient history; if a stock did not trade at least once every 15 minutes for the last 14 periods, the server will not report an RSI for that stock.”
We look at all the U.S. exchanges for stocks with a price range from $35 – $65 exhibiting a minimum 15 minute RSI value of 80. The Heartbeat alert in Trade-Ideas simply lists all the stocks that pass this short list of filters. That’s it.
How do we trade this pattern? A successful trade in this strategy means we sell short all the opportunities that appear. We also do not use a stop loss for this system (but this is a higher risk tolerance setting than you may desire. Experiment with the backtesting results by placing various stop loss values and see why we chose not to use one). We enter anytime during the market session at the time of the signal and hold the trade until the open the next day. The results speak for themselves for the 3 weeks ending 02/09/2009: a 68% success rate where average winners are almost 50% larger than average losers.
Provided by:Trade Ideas (copyright © Trade Ideas LLC 2009). All rights reserved. For educational purposes only. Remember these are sketches meant to give an idea how to model a trading plan. Trade-Ideas.com and all individuals affiliated with this site assume no responsibilities for trading and investment results.
Description: “Profit From High Relative Strength Stocks”
Type or copy/paste this string directly into Trade-Ideas PRO using the “Collaborate” feature (right-click in any strategy window):
You can also build the strategy from Figure 1 below.
Figure 1 below shows the configuration of this strategy:

Where 1 alert and 3 filters are used with the following specific settings:
- Heartbeat Alert; no additional setting
- Min Price Filter = 35 ($)
- Max Price Filter = 65 ($)
- Min 15 Minute Relative Strength Indicator Filter = 80
The definitions of these indicators appear here: https://trade-ideas.54solutions.com/Help.html.
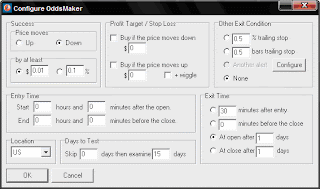
That’s the strategy, but what about the trading rules? How should the opportunities the strategy finds be traded? Here is what The OddsMaker tested for the past 3 weeks ending 2/09/2009 given the following trade rules:
- On each alert, sell short the symbol (price moves down to be a successful trade)
- Schedule an exit for the stocks at the open after 1 day
- Start trading from the open and stop at market close
The OddsMaker summary provides the evidence of how well this strategy and our trading rules did. The settings are shown here in Figure 2.
The results (last backtested for the 3-week period ending 02/09/2009) are as follows:

Understand these backtest results from The OddsMaker by reading the User’s Manual: https://trade-ideas.54solutions.com/OddsMaker/Help.html
UPDATE SINCE PUBLICATION:
The market is always adapting and changing – what works for a couple of weeks can easily change. The most recent OddsMaker results show an advantage when these trades are taken to the LONG side. This makes sense given the fragile ‘bottom’ and recent bullish corrections we’ve had of late.
Q: Thanks! Where does that leave me with this strategy?
A: The market is at an inflection point and this is not the best strategy for Phase 1 (Accumulation) and Phase 3 (Distribution) as my friend Brian Shannon calls these non-trending periods. Wait for the market to confirm a direction: if its down that use this strategy to sell short opportunities. If the market’s direction is up use this strategy to go long. The point is that this strategy is a trending market strategy. Don’t use it if the market can’t decide where it’s going.
— by Dan Mirkin & David Aferiat, Managing Partners, Trade Ideas LLC
www.trade-ideas.com, dan@trade-ideas.com