What to Do When You’re Suspicious of Low Volume Rises in the Market
What to Do When You’re Suspicious of Low Volume Rises in the Market
Jul 10, 2007
TraderMike’s commentary on the markets yesterday included this observation,
“I’m always suspicious of low volume rises and this time is no different, especially for the S&P 500 which has been making lower highs and lower lows for the last month or so.”
I agree. In fact we’ve created a couple of strategies in Trade-Ideas that model the behavior TraderMike describes, namely; upward price movements on lite volume.
The question is how to trade such patterns? Is the market favoring this kind of strategy?
Fortunately much of the guesswork can be removed from the equation. Trade-Ideas’ event-based backtesting tool, The Odds Maker, summarizes how each of the strategies are doing over the last 3 weeks in the market. It turns out that this strategy is very sensitive to when during the day its traded and how long the positions are held if the trailing stop threshold is not met. Let’s look at each strategy and what The Odds Maker suggests in terms of position management.
The first strategy’s genesis came from a pattern described by Andy Swan (Note: to see the what Andy’s up to these days, check out his NetVibes for stocks and trading – a great news dashboard for traders – called MyTrade). Below we’ve updated the strategy by adding a minimum Average Daily Volume requirement of 500,000 shares/day and we’ve required that all the alerts occur with a Max Distance from the Inside Market of 0.1%. We add this last filter to ensure that the strategy is not dependent on catching a sudden trade way outside the market – in other words we keep the strategy rooted in what is typically possible for a trader to do. We also removed an alert that just did not help The Odds Maker results at all – this alone proved to be a valuable insight.
Updated Strategy Session: Moved Up on Lite Volume? Fade It.
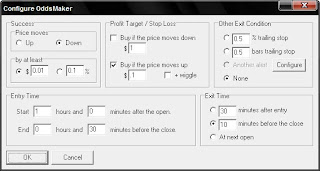
Here is a picture of The Odds Maker configuration screen that shows one set of rules for position management of this strategy:
Here is The Odds Maker Summary:
98 / 279 = 35.13% winning trades defined as movement down $0.01 with all positions exited at 10 minutes before the close; Average winner = $0.2103, Average loser = $-0.0939, Net winnings = $4.99, Best = $1.23, Worst = $-0.10; Casino Factor = 75.55%
Daily summary:
6/19 : 0.4900/22
6/20 : 0.4000/6
6/21 : 0.2000/2
6/22 : 1.0900/5
6/25 : 1.0600/5
6/26 : 0.0000/0
6/27 : 0.6600/7
6/28 : 2.2500/76
6/29 : 2.0400/21
7/02 : 0.7400/8
7/03 : 0.1900/21
7/04 : 0.0000/0
7/05 : 0.3700/24
7/06 : 1.9100/65
This summary won’t mean much unless you read an explanation from The Odds Maker quick manual.
Take the average winning trade and average losing trade and make a ratio of it. You can then categorize and position the value of this strategy into a convenient 2×2 decision box that we discussed before.
Our second strategy carrying the same theme appeared in our post entitled,
Strategy Session: Exhausted Rallies
Take a look at this strategy and try to model it within The Odds Maker. Not a customer? You have 10 free trials before we ask you to decide – simply download the latest version of Trade-Ideas PRO.

