Optimize Expectancy with Volatility-Adjusted Targets
Optimize Expectancy with Volatility-Adjusted Targets
Jan 15, 2007
This is the 4th installment of our series on trading with a backtested system. The series uses the features of The Odds Maker in its examples, but the lessons apply to any tool a trader employs for backtesting as well as many approaches to trading.
Today we focus on taking and holding a position and present an advanced method of determining stop losses and price targets for short-term trades. An alternate method of finding price targets using VWAP and pivot points is the topic of discussion at TraderFeed today.
1.0 Take the Position:
A trader should follow a trading plan criteria for determining position size and expectancy for his/her trades. (We refer to some excellent articles on these subjects written by TraderMike).
There are many ways to enter a position – all in, piecemeal, etc. Our recent conversations with an institutional customer (from which this series of articles is based) focused on the following approach: Split the entry position into any number of equally divided segments (e.g., 2).
For example consider the goal of getting into 2000 shares. Start with 1000 to initiate the position and manage the risk of the trade. It is not necessary to jump right in by hitting bids or taking offers. Adding liquidity helps reduce the trade-impact of a position.
For the subsequent segments of a position, determine whether or not to add to this position or cut losses. An input into this decision comes from knowing the value of a strategy’s average loser. The Odds Maker readout provides an Average Loser value for strategies developed in Trade-Ideas. This number is a good basis for risk management. Avoid taking losses that are bigger than the Average Loser for a strategy.
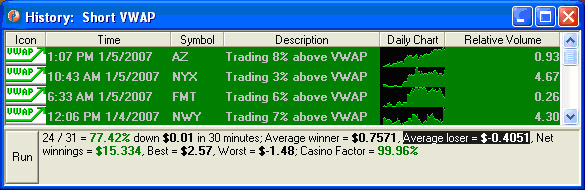 Figure 1.1 In this example (Short VWAP) a trader ends trades and avoids losers bigger than 40 cents.
Initiating a position at half size or in multiple segments allows a feel for the trade without committing all the capital at once. If, once entered, the trade starts to immediately go against you, consider not adding to the position but merely managing the risk. However, if once entered, the position turns positive quickly, consider adding your other segment(s) shortly afterwards (e.g., 10-15 minutes). Look for a small pullback or other indication to get into the other segment(s) of the position.
2.0 Hold the Position:
As mentioned in Figure 1.1 above, avoid taking losses that are bigger than a strategy’s Average Loser. However each stock appearing in that strategy has its own natural volatility and distinct way of trading. A trader may leave an unecessary piece of return on the table if a stock’s own natural volatility is a large portion of the strategy’s average loser value. To adjust your risk tolerance we strongly suggest that you look at the 15-minute volatility for any stock in which you take a position. This is easily done via the Trade-Ideas Stock Research Page https://trade-ideas.54solutions.com/StockInfo/.
Go to that page and type in the stock in which a position exists where it says Stock Symbol Lookup. From the “Short VWAP” strategy in Figure 1.1 above let’s take a look at the volatility for symbol AZ.
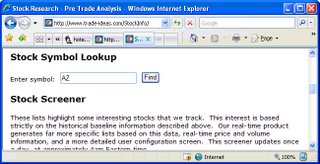 Figure 2.1 Trade-Ideas Stock Research page
Press the Find button to view the Company Information page for AZ. Scroll down to the Technicals section to see the Volume Weighted Volatility (VWV) for any company.
 Figure 2.2 The Technicals section of the Company Information page
Figure 2.2 shows the Volume Weighted Volatility (VWV) for AZ as $.0225 as of end of day 7 January 2007. That means that on average this stock moves around randomly about 2 cents in any given direction every 15-minute time period. This value is calculated every night and takes an average over the last 30 trading days of activity.
Add the VWV for the particular stock to The Odds Maker’s Average Loser for the strategy to get any stock’s total risk tolerance value in a position. In this case 2 cents added to the 40 cent average loser yields a 42 cent downside for AZ.
Volatility-Adjusted Average Loser (Stop Loss) = Strategy’s Average Loser + Stock’s Volume Weighted Volatility
Another stock in Figure 1.1, NYX, is much more volatile than AZ. According to the Company Information page NYX’s Volume Weighted Volatility (VWV) is $0.61 per 15-minute time period as of end of day, 7 January 2007 . For NYX add the stock’s 61 cents to the strategy’s 40 cent Average Loser for a total of $1.01 in ‘wiggle room’ or roughly $100 dollar risk per 100 shares before you exited the trade.
The Volatility-Adjusted Average Loser (and the same for the Average Winner) represents a important method for optimizing a trader’s calculations of expectancy. It is a way to focus on exits (and targets) once you’ve determined a good strategy. Position management requires a knowledge of expectancy, position sizing, position segmenting, and price targets. These elements are more important than a strategy’s fleeting success in the market. The market can evolve and render a strategy of indicators and entry signals less effective – forcing a trader to move onto a new method of engaging the market. The principles of position management do not change as a function of the market’s behavior – they are always in effect.