The 2 x 2 Decision Box for Determining a Good Trading System
The 2 x 2 Decision Box for Determining a Good Trading System
Jan 11, 2007
I’ve been caught red-handed with a smaller picture for evaluating a good trading system that excluded other, equally valid possibilities.
Yesterday I wrote about two key elements every successful trading system has and then provided benchmark values as a sort of standard to judge everything. John Forman correctly described in his article today an alternate and even more profitable scenario featuring a trading system with different values than I used. First John’s bio:
John Forman, author of The Essentials of Trading, is a near 20-year veteran of the financial markets. He has traded just about everything an individual trader is likely to trade. He has worked as an analyst in the foreign exchange, fixed income, and energy markets, and has published literally dozens of articles on market analysis and trading methods.
Currently, John is a principal of, and the Managing Analyst & Chief Trader for Anduril Analytics. He is a contributor to Trading Markets and posts regular comments and thoughts on both the Trading & Investing Essentials and Time Crunch Trading Report blogs.
Below then is an actual big picture that serves to frame the points John and I are making – I’m also throwing in Lord Tedders’ imperial and sanguine comments into the mix. It’s a great way to finally figure out when a trading system is good or great.
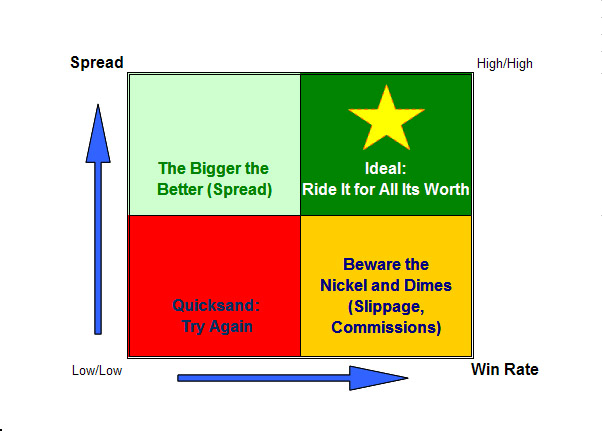
Figure 1: The 2 x 2 Decision Box for determing a good trading system
Source: Trade-Ideas.com, D TradeIdeas
This is a tired but true consultant’s tool for understanding the relation of two elements and their possible outcomes. The square above consists of 4 quadrants that are numbered in descending order of preference. Box 1 is the upper right quadrant (“Ideal“), Box 2 is the upper left quadrant (“Bigger/Better“), Box 3 is the lower right quadrant (“Beware“), and Box 4 is the lower left quadrant (“Quicksand“).
Boxes 1 and 4 are easy enough to understand. If a trader finds a system that exhibits a high win rate (e.g., 80%) and a large enough spread (e.g., an average winner to loser ratio of 2:1), trade it for all its worth and make hay while the sun shines. Conversely if a system produces low win rates and small/thin spreads, it’s time to keep testing and remain grateful that this knowledge was received before any precious capital was committed.
Box 2 describes the point John Forman makes in his article – one that I missed in mine yesterday. It is possible to be very successful with a system that offers a low win rate but more than compensates with a significantly large spread (e.g., average winner to average loser ratio of 5:1).
Box 3 represents an unenviable situation: you produce a system with a high win rate – nice. However the thinness of the spread between average winner and loser actually creates a negative outcome when you consider your cost of doing business (e.g., commissions, slippage, etc.).
You can approach modeling one of two main ways: You can whip out the micronmeter to measure the mudpuddle and zealously account for minutae like commissions, print errors, etc OR you can shoot for a large enough spread to account for these items – and then some. Different backtesting applications use different approaches. If you don’t know how The Odds Maker does it, read how.