Odds Maker Proves that Time is Money
Odds Maker Proves that Time is Money
Sep 12, 2006
First there’s an interesting factoid regarding the latest “Friends and Family” release of The Odds Maker to share with you:
According to our database The Odds Maker is being run by someone around the world every 5 minutes throughout the day – including before and after market hours. International traders and insominacs unite!
How to cut losers and let your winners run
Let’s make sense out of a very important and often overlooked aspect of the trade: Time in relation to Risk/Reward. Understanding time in terms of risk management can be the deciding factor in making one trade a winner or a loser.
Everyone who trades or has traded can tell this same story. This story continuously plays itself out in the markets no matter what time frame:
“Dear [Insert mentor, coach, spouse name here],
I was in this trade. The trade was doing very well, so I hung on saying, ‘Let my winner run’. Then it started to pull back and I thought, ‘Well it is just a little pullback’, so I stayed in the trade. Then it started to really come in and I decided I am going to wait until I get to flat cause I am playing with the “house” money.
Then it went against me and I thought, ‘Man, I am down – I want to get even before I get out’. Finally after the losing trade crossed the infamous PPT or Point of Pain Threshold (i.e., the exact point where you simply can’t take the pain of holding the losing trade any longer) I cursed and bailed out – at market. I then hit myself.”
So the question is, how long should you be in any trade? Using stops? Where do you put them? Of course there is the popular proverb, “Cut your losers and let your winners run,” but everyone that trades knows that it is not that easy. The reason it is not easy is because we don’t know what is or is not a good winner or loser, furthermore, what should we expect to gain or lose from a trade? Kudos to those who frame a trade with targets. Is there room to improve how these targets are set?
Enter The Odds Maker. Before The Odds Maker was introduced answering this question usually meant getting a Ph.D. in Bloody Noses from the University of Trial and Error. Today however, there is a much easier approach.
Let’s look at the example of a strategy that looks to buy strong stocks on a pullback from highs.
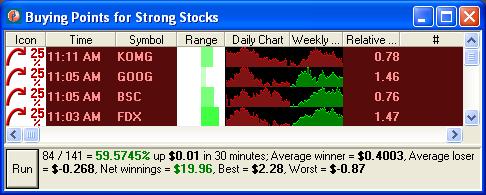
We ran The Odds Maker on this set up and got the following results:
84 / 141 = 59.5745% up $0.01 in 30 minutes; Average winner = $0.4003, Average loser = $-0.268, Net winnings = $19.96, Best = $2.28, Worst = $-0.87.
We tested holding the trade for 30 minutes.
Notice that the average winner is $0.40 cents while the average loser is $-0.268 cents. It is important to make sure that your average winner is considerably bigger than your average loser.

Then we ran the test on a shorter time frame of 5 minutes. The results are interesting.
When holding the trade for a much shorter time frame we reduced our winning % just over 3% in overall profitability, but our average winner at $0.32 was now almost three times as large as our average loser at$-0.139. Having your winner being almost 3X your loser is a big positive. Overall our net winnings dropped slightly, from $19.96 to $18.63. But in terms of risk we reduced our risk by reducing the time in the trade considerably.
When you run The Odds Maker to evaluate the strategy that works with your trading style, consider how long you are planning to stay in the trade. The example that we illustrate clearly proves that less is more. It also helps to illustrate another important aspect of what The Odds Maker provides: gauging what to expect from a particular trade in a strategy. In the 5 minutes example you should expect to gain $0.32 cents per trade and lose $-0.139. Before The Odds Maker this type of analysis was simply very hard to determine.
For another example of Risk/Reward take a look at the post and comments from Fallon D’s latest look at The Odds Maker.