Looking at the Markets with GOOG Lenses
Looking at the Markets with GOOG Lenses
Jan 22, 2006

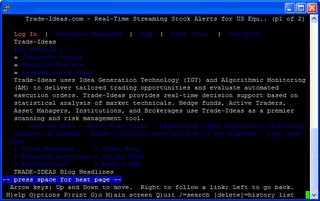
Here is a picture of what a Google bot sees when it visits the Trade-Ideas website or any other site on the Internet:
Click here for what our homepage actually ‘looks’ like with human eyes. Big difference – a lot of noise gets stripped away.
It is not a stretch to make the same comparison between how the Google bot analyzes the web and how Trade-Ideas does the same for the markets.
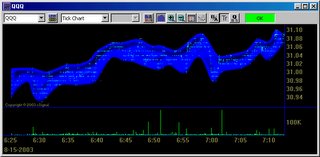
For example here is how TI sees market technicals:
We even describe how we do it in an article we wrote when Trade-Ideas was still in beta. Read the outline below or follow the link to the full article if you want to walk a mile in Trade-Ideas’ moccasins and understand how the tool ‘sees’ the market.
Full Article, “Details of Statistical Analysis“; Mirkin, Dan, and Smolen, Philip; 2002
Outline:
- Use of Statistical Analysis
- Why Use Statistical Analysis?
- Using Volume to Find Price Levels
- Using Tick Data to Find Price Levels
- Using Tick Data to Confirm Trends
- Variable Time Scales
- Using Time to Confirm Trends
- Effects of Volatility
- Geometric Pattern Alerts
- Filtering

