200 Day SMA Good Support for a Swing Trade: August TAS&C Traders’ Tips
200 Day SMA Good Support for a Swing Trade: August TAS&C Traders’ Tips
Jul 23, 2009
August Issue
“It’s not being wrong that kills you, it’s staying wrong that kills you.” Jeff Macke, Trader
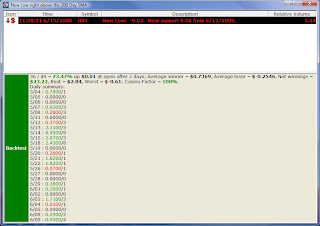
To recap briefly The OddsMaker doesn’t just look at a basket of stocks, à priori, to generate backtest results, it considers any stock that matched a desired pattern in the market, finds that stock, and applies the backtest’s rule set before summing up the results into a detailed set of totals: win rate, average winner, average loser, net winnings, confidence factor, See Figure 3.
This strategy owes it’s high percentage win rate, in part, to a decision to set the Days Up/Down in a Row filter to only show us stocks that are down 5 days in a row or more (Max Days Up = -5).
Description: “New Low Right Above the 200 Day SMA”
Provided by:
Trade Ideas (copyright © Trade Ideas LLC 2009). All rights reserved. For educational purposes only. Remember these are sketches meant to give an idea how to model a trading plan. Trade-Ideas.com and all individuals affiliated with this site assume no responsibilities for trading and investment results.
Type or copy/paste this shortened string directly into a browser then copy/paste the full length link into Trade-Ideas PRO using the “Collaborate” feature (right-click in any strategy window):
http://bit.ly/16eHIM (case sensitive)
Figure 1 below shows the configuration of this strategy:

Where 1 alert and 3 filters are used with the following settings:
· New Low Alert
· Max Up Days = -5 (Days)
· Min Up from 200 Day SMA Filter = 0.01 (%)
· Max Distance from Inside Market Filter = 1.0 (%)
The definitions of these indicators appear here: https://trade-ideas.54solutions.com/Help.html.
That’s the strategy, but what about the trading rules? How should the opportunities that the strategy finds be traded?
In summary these are stocks that are being sold off aggressively right into the 200 day SMA. We evaluated several time frames, but were ultimately led to selling at the open after two days. Note that we did not check the box for setting a profit target or stop loss. The OddsMaker results provide good guidelines, however, using the average winning and average losing trade.
Here is what The OddsMaker tested for the past 30 days ending 6/09/2009 given the following trade rules:
- On each alert, buy (long) the symbol (price moves up to be a successful trade)
- Schedule an exit for the stocks at the open after 2 days
- Trade any time during the market session
The OddsMaker summary provides the evidence of how well this strategy and our trading rules did. The settings are shown here in Figure 2.

The results (last backtested for the 30 day period ending 06/09/2009) are as follows:
The summary reads as follows: This strategy generated 49 trades of which 36 were profitable for a win rate of 73%. The average winning trade generated $0.74 in profit and the average loser lost $0.25. The net winnings of using this strategy for 30 trading days generated $23.22 points. If you normally trade in 100 share lots, this strategy would have generated $2322. The z-score or confidence factor that the next set of results will fall within this strategy’s average winner and loser is 100%.
Understand these backtest results from The OddsMaker in more detail by reading the User’s Manual: https://trade-ideas.54solutions.com/OddsMaker/Help.html
— by Dan Mirkin & David Aferiat, Managing Partners, Trade Ideas LLC
www.trade-ideas.com, david@trade-ideas.com