


Change in 1 Year
Table of Contents
- Understanding the Change in 1 Year Dollar Filter
- Change in 1 Year Dollar Filter Settings
- Using the Change in 1 Year Dollar Filter
- FAQs
Understanding the Change in 1 Year Dollar Filter
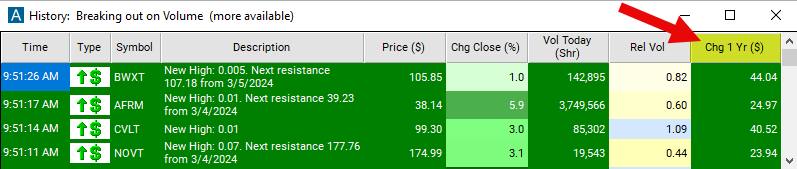
The "change in 1 year ($)" filter compares the current price to the price 1 year ago, measured in dollars. Traders and investors may use this filter to identify stocks that have experienced significant price movements over the past year, which could indicate potential trends or opportunities for further analysis. It can also help them understand the volatility and overall performance of a stock within a specific timeframe.
The formula for the $ version is simply the current price minus the old price. Bigger numbers mean that the price has moved up more. Negative numbers mean that the price has moved down. 0 means no change.
The current price is based on the last print. There is no smoothing or averaging. This updates before, during, and after market hours.
Change in 1 Year Dollar Filter Settings
The settings of each Trade Ideas filter are defined in the Window Specific Filters Tab located in the Configuration Window of your Alert/Top List Window.
Here is how to setup the filter in your configuration window:
- Set the min value to 20 to see stocks which are up at least $20 from 1 year ago.
Using the Change in 1 Year Dollar Filter
Several trading strategies can be employed with the Change in 1 Year Dollar filter. Here are a few examples:
Momentum Trading: Traders can use the change in 1 year ($) filter to identify stocks that have exhibited strong upward momentum over the past year. They may look for stocks with significant positive changes in dollar terms, indicating that the stock has been consistently rising. Once identified, traders may consider entering long positions in these stocks, expecting the momentum to continue.
Contrarian Trading: Conversely, traders can use the filter to identify stocks that have experienced significant negative changes in dollar terms over the past year. These stocks may have fallen out of favor with investors but could potentially be undervalued. Contrarian traders may consider entering long positions in these stocks, betting on a potential reversal or turnaround in their fortunes.
Volatility Trading: High changes in 1 year ($) can indicate volatility in a stock's price movement. Traders who specialize in volatility trading may seek out stocks with significant changes in dollar terms as opportunities for short-term trading. They may employ strategies such as buying straddles or strangles to profit from short-term price fluctuations.
FAQs
What does the "change in 1 year ($)" filter indicate?
- This filter indicates the absolute dollar amount by which a stock's price has changed over the course of one year. It helps traders understand the magnitude of price movements within a specific timeframe.
How is the "change in 1 year ($)" calculated?
- The calculation involves subtracting the stock's price from one year ago from its current price. The resulting value represents the absolute dollar amount of the price change over the past year.
How should I interpret a high/low value in the "change in 1 year ($)" filter?
- A high positive value indicates that the stock's price has risen significantly over the past year, while a high negative value indicates a significant decline. Conversely, a low value suggests minimal price movement.
Can the "change in 1 year ($)" filter be used alone to make trading decisions?
- While the filter provides valuable information, it should be used in conjunction with other technical and fundamental analysis techniques. It's essential to consider multiple factors before making trading decisions.
Filter Info for Change in 1 Year [UYD]
- description = Change in 1 Year
- keywords = Single Print
- units = $
- format = p
- toplistable = 1
- parent_code =
 Change in 1 Year [UYP]