


Position in Range
Table of Contents
- Understanding the Position in Range Filter
- Position in Range Filter Settings
- Using the Position in Range Filter
- FAQs
Understanding the Position in Range Filter
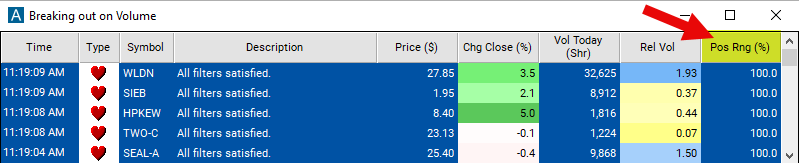
This filter compares the price of the last print to the high and the low for the day. This is expressed as a percentage. 100 means the last print was at the high for the day, 0 means the last print was the low. 50 means that the last print was half way between the high and the low.
Normally the daily high and low only update during normal market hours. This is determined by the exchanges. Before the market is open, this filter is not available. If you want to see any alerts before the market opens, do not fill in a value for either of these filters.
This filter is available after market hours, even though the high and the low do not update. It is possible for the value to be above 100% or below 0% if the price continues to go up or down after the close. It is also possible to see these values during market hours, although that is far less common.
Position in Range Filter Settings
The settings of each Trade Ideas filter are defined in the Window Specific Filters Tab located in the Configuration Window of your Alert/Top List Window.
Here is how to setup the filter in your configuration window:
- Set the minimum filter to 100 and leave the max filter blank to see stocks trading on highs.
Using the Position in Range Filter
Several trading strategies can be employed with the Position in Range filter. Here are a few examples:
Range Trading: Traders may identify stocks that are trading within a defined price range and look to capitalize on price oscillations within that range. They may enter long positions near the lower end of the range and short positions near the upper end, aiming to profit from price reversals back toward the mean.
Trend Confirmation: Traders may use the position in range filter to confirm the strength of an existing trend. If the price remains consistently near the upper end of the range during an uptrend or near the lower end during a downtrend, it may indicate the trend's continuation. Traders may enter positions in the direction of the trend based on this confirmation.
Reversal Trading: Contrarian traders may look for stocks that are trading near the extremes of their defined price range. If the price reaches an extreme level and shows signs of reversal, such as bullish or bearish candlestick patterns or divergence in oscillators, traders may enter positions anticipating a reversal back toward the mean.
FAQs
What does the "position in range" filter indicate?
- This filter indicates the current position of a stock's price within a defined price range, expressed as a percentage. It helps traders assess the relative strength or weakness of the price movement within the specified range.
How is the position in range calculated?
- The position in range is typically calculated as the percentage of the distance between the current price and either the high or low of the defined range. For example, if the current price is halfway between the high and low, the position in range would be 50%.
Can the "position in range" filter be used for both long and short trading strategies?
- Yes, the filter can be used for both long and short trading strategies. Traders may assess the position of the price within the range to identify potential entry or exit points for long or short positions based on their trading strategy.
Filter Info for Position in Range [RD]
- description = Position in Range
- keywords = Highs and Lows Single Print
- units = %
- format = 1
- toplistable = 1
- parent_code =