


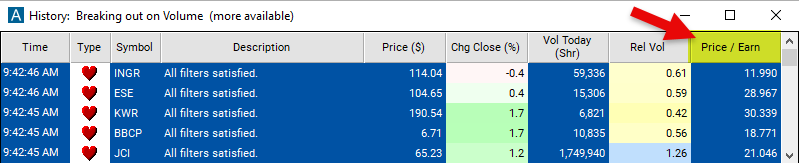
Price / Earnings Ratio
Table of Contents
- Understanding the Price Earning Ratio Filter
- Price Earning Ratio Filter Settings
- Using the Price Earning Ratio Filter
- FAQs
Understanding the Price Earning Ratio Filter
The Price/Earnings (P/E) ratio, also known as the earnings multiple, is a fundamental financial metric used to assess the valuation of a company's stock in relation to its earnings. It compares the current market price of a company's stock to its earnings per share (EPS), providing insight into how much investors are willing to pay for each unit of earnings generated by the company.
Calculation: The formula for calculating the P/E ratio is straightforward: Stock Price / Earnings Per Share = P/E Ratio.
Interpretation: A high P/E ratio suggests that investors are willing to pay a premium for each unit of earnings, indicating optimism about the company's future growth prospects. A low P/E ratio may indicate that the company's stock is undervalued relative to its earnings, potentially presenting a buying opportunity. The P/E ratio can vary significantly across industries and companies, so it's essential to compare a company's P/E ratio to its peers or industry averages for better context.
Price Earning Ratio Filter Settings
Configuring the "Price Earning Ratio" filter is simple and can be done within the Window Specific Filters Tab of the Configuration Window in your Alert/Top List Window.
Here's how to set up the filter in your configuration window:
- Set the minimum value to 10 to see only stocks with a P/E Ratio of 10/1.
Using the Price Earning Ratio Filter
The "Price Earning Ratio" filter can be used in various trading strategies, including:
Value Investing: Identify stocks with low P/E ratios relative to their peers, industry averages, or historical norms. Take long positions in undervalued stocks, anticipating potential price appreciation as the market reevaluates their earnings potential.
Growth Investing: Look for stocks with high P/E ratios that reflect market optimism about future earnings growth. Take long positions in high-growth stocks with sustainable growth prospects, expecting continued earnings expansion to justify their valuation multiples.
Contrarian Strategy: Identify stocks with significantly high or low P/E ratios compared to historical levels, industry averages, or market sentiment. Take contrarian positions by buying undervalued stocks with low P/E ratios when market sentiment is pessimistic or selling overvalued stocks with high P/E ratios when market sentiment is overly optimistic.
FAQs
What does the P/E ratio indicate?
- The P/E ratio indicates how much investors are willing to pay per dollar of earnings generated by a company. It reflects the valuation of a stock relative to its earnings and provides insight into investor sentiment towards the company's growth prospects and risk profile.
How is the P/E ratio calculated?
- The P/E ratio is calculated by dividing the current market price of a company's stock by its earnings per share (EPS). The formula is: P/E Ratio = Stock Price / Earnings Per Share.
Interpreting High/Low P/E ratios:
- A high P/E ratio may indicate that investors are willing to pay a premium for the company's earnings, suggesting optimism about its growth potential. Conversely, a low P/E ratio may signal that the stock is undervalued relative to its earnings, potentially presenting a buying opportunity.
Filter Info for Price / Earnings Ratio [PERatio]
- description = Price / Earnings Ratio
- keywords = Fundamentals Changes Daily
- units = Ratio
- format = 3
- toplistable = 1
- parent_code =