


EPS
Table of Contents
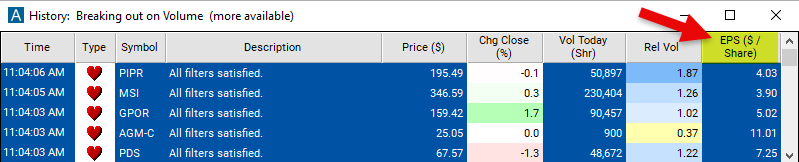
Understanding the EPS Filter
Earnings Per Share (EPS) is a financial metric that measures the portion of a company's profit allocated to each outstanding share of common stock. It represents the company's net income after taxes and preferred stock dividends have been deducted, divided by the total number of shares outstanding. EPS is a key indicator of a company's profitability and is widely used by investors to evaluate the company's performance and growth potential.
Calculation of EPS: EPS is calculated by dividing the company's annual net income (profit) by the total number of shares outstanding during that period. The formula for EPS is: Net Income / Number of Shares Outstanding = EPS. For example, if a company reported a net income of $1 million and has 1 million shares outstanding, the EPS would be $1 ($1 million / 1 million shares).
Significance of EPS: EPS provides insight into how profitable a company is on a per-share basis, allowing investors to compare the earnings performance of different companies. Investors often use EPS to assess a company's financial health, growth prospects, and potential future dividends. Higher EPS generally indicates greater profitability and potential for shareholder returns, while declining or negative EPS may raise concerns about the company's performance.
Values entered into this Window Specific Filter needs to be entered in price per share.
EPS Filter Settings
Configuring the "EPS" filter is simple and can be done within the Window Specific Filters Tab of the Configuration Window in your Alert/Top List Window.
Here's how to set up the filter in your configuration window:
- Set the minimum value to 3 to see only stocks where the earnings per share gain is at least $3 per share.
Using the EPS Filter
The "EPS" filter can be used in various trading strategies, including:
EPS Surprise Trading: Monitor companies' quarterly earnings releases for surprises in EPS relative to analysts' expectations. Take long positions in companies that exceed EPS estimates (positive surprises) and short positions in companies that miss EPS estimates (negative surprises). Utilize market reaction to earnings surprises to capitalize on short-term price movements.
EPS Growth Investing: Focus on companies with consistent and robust EPS growth over time. Look for companies with accelerating EPS growth rates compared to historical averages or industry peers. Invest in companies with strong earnings momentum, as EPS growth can drive stock price appreciation over the long term.
EPS Trend Following: Track long-term trends in companies' EPS growth rates and stock prices. Take long positions in companies with upward EPS trends and avoid or short companies with declining EPS trends. Use technical indicators and chart patterns to confirm EPS trends and entry/exit points for trades.
FAQs
What is EPS, and why is it important?
- EPS, or earnings per share, is a financial metric that represents the portion of a company's profit allocated to each outstanding share of common stock. It is important because it provides insight into a company's profitability on a per-share basis, allowing investors to assess its financial performance and growth potential.
How is EPS calculated?
- EPS is calculated by dividing the company's net income (after taxes and preferred stock dividends) by the total number of shares outstanding. The formula for EPS is: Net Income / Number of Shares Outstanding = EPS.
What does positive/negative EPS indicate?
- Positive EPS indicates that the company generated profits during the period, with each share entitled to a portion of those earnings. Negative EPS suggests that the company incurred losses, meaning each share represents a portion of those losses.
Filter Info for EPS [EPS]
- description = EPS
- keywords = Fundamentals Changes Daily
- units = $ / Share
- format = 2
- toplistable = 1
- parent_code =