


Days To Cover
Table of Contents
- Understanding the Days to Cover Filter
- Days to Cover Filter Settings
- Using the Days to Cover Filter
- FAQs
Understanding the Days to Cover Filter
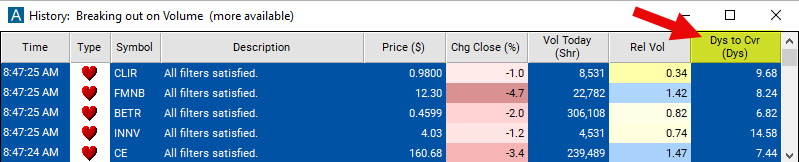
The "days to cover" filter in stock trading is a metric used to assess the level of short interest in a particular stock. Short interest refers to the number of shares of a security that have been sold short by investors but have not yet been covered or closed out. The "days to cover" ratio indicates how many days it would take for short sellers to cover their positions based on the average daily trading volume of the stock.
Here's a breakdown of how the days to cover filter works:
Calculation: The days to cover ratio is calculated by dividing the total number of shares sold short (short interest) by the average daily trading volume of the stock.
Interpretation: A higher number means that the market has a bearish sentiment about this stock. A lower number is more bullish.
Days to Cover Filter Settings
Configuring the "Days to Cover" filter is simple and can be done within the Window Specific Filters Tab of the Configuration Window in your Alert/Top List Window.
Here's how to set up the filter in your configuration window:
-
Adjust the minimum value to 5 to see only stocks with a higher short interest.
-
Adjust the maximum value to 1 to see only stocks with relatively lower short interest.
Using the Days to Cover Filter
The "Days to Cover" filter can be used in various trading strategies, including:
Short Squeeze Identification: A high days to cover ratio may indicate a high level of short interest in a stock. Traders might look for stocks with a days to cover ratio above a certain threshold, suggesting the potential for a short squeeze if positive news triggers a rapid price increase, forcing short sellers to cover their positions.
Contrarian Strategy: Conversely, a low days to cover ratio may suggest low short interest in a stock. Traders might interpret this as a bullish signal, as there are fewer short sellers to push the stock price down. They may consider taking long positions in anticipation of potential price appreciation.
Confirmation Tool: Traders may use the days to cover ratio as a confirmation tool in conjunction with other technical or fundamental indicators. For example, they might look for stocks with a high days to cover ratio that are also showing signs of bullish price action or positive fundamental developments, reinforcing their bullish bias.
FAQs
What does "days to cover" mean?
- Days to cover represents the number of days it would take for short sellers to cover their positions based on the average daily trading volume. It is calculated by dividing the total number of shares sold short by the average daily trading volume.
Why is days to cover important for traders?
- Days to cover provides insights into market sentiment and potential short squeeze opportunities. A high days to cover ratio suggests a higher level of short interest in a stock, indicating the potential for a short squeeze if positive news triggers a rapid price increase.
What is a short squeeze?
- A short squeeze occurs when a heavily shorted stock experiences a rapid price increase, forcing short sellers to buy back shares to cover their positions. This buying pressure can further drive up the stock price, leading to additional short covering and creating a feedback loop of upward price movement.
How can I interpret changes in the days to cover ratio?
- Significant changes in the days to cover ratio, especially when accompanied by changes in stock price or trading volume, may indicate shifts in market sentiment. For example, a decrease in the days to cover ratio could suggest decreasing short interest or increasing bullish sentiment, while an increase could suggest the opposite.
Filter Info for Days To Cover [DTC]
- description = Days to Cover
- keywords = Fundamentals Changes Daily
- units = Days
- format = 2
- toplistable = 1
- parent_code =