


Volume 1 Minute
Table of Contents
- Understanding the Volume 1 Minute Percent Filter
- Volume 1 Minute Percent Filter Settings
- Using Volume 1 Minute Percent in Trading
- FAQs about Volume 1 Minute Percent
Understanding the Volume 1 Minute Percent Filter
The Volume 1 Minute Percent Filter shows how the last minute's trading volume compares to the expected volume for a one-minute period based on the average trading volume over the last 10 days. The result is a percentage.
A percentage of 100% would indicate that the volume of shares traded aligns exactly with what would be expected given the average daily volume. Any percentage over 100% indicates that trading volume is higher than expected for the last 1-Minute period.
For instance, if you get a result of 400%, that means the stock has been trading at 4 times its average one-minute volume over the last minute. Conversely, if you get a result of 50%, that means the stock has only been trading at half of its average one-minute volume.
The Volume 1 Minute Percent Filter works before and after regular market hours. You should, however, adjust the thresholds for pre- and postmarket scanning, since stocks typically trade significantly less during these hours.
The formula for this filter is as follows:
((Volume 1 Minute in Shares/Average Daily Volume over the last 10 days) *390) *100
390 represents the number of one-minute periods in a 6.5-hour trading day.
100 turns the ratio into a percentage.
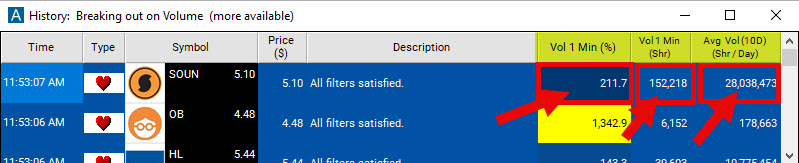
Take SOUN for example, the Average Daily Volume over the last ten days of this stock was 28,038,473 shares and the Volume 1 Minute in Shares was 152,218. Applying the above formula SOUN's Volume 1 Minute in % would be calculated as follows:
((152,218/28,038,473)*390)*100 = 211.7%
This means that SOUN's volume of shares traded in the last minute represents 211.7% of the average one-minute volume (over the last 10 trading days).
Volume 1 Minute Percent Filter Settings
Activating the Volume 1 Minute % Filter is straightforward. You'll find its settings under the Window Specific Filters Tab in your Alert/Top List Window's Configuration Window.
You can set a minimum and/or maximum value, and stocks that don't fit within your parameters are automatically excluded from your scan results.
-
To find stocks that have been trading at least 3 times as much as normal in the last minute, add the Volume 1 Minute Percent Filter to your scan and enter 300 in the minimum field in the Windows Specific Filters Tab.
-
To find stocks that have been trading less than normal over the last minute, add the Volume 1 Minute Percent Filter to your scan and enter 90 in the maximum field in the Windows Specific Filters Tab.
Using Volume 1 Minute Percent in Trading
The Volume 1 Minute % Filter can be a particularly effective tool for active traders, as it allows them to monitor unusual volume activity within very short time-frames. By comparing the most recent one-minute trading volume to the average 1-minute volume over the past 10 trading days, traders can gain insights into investor sentiment, identify potential trends, and make more informed trading decisions.
Here's how you might use the Volume 1 Minute % Filter in trading:
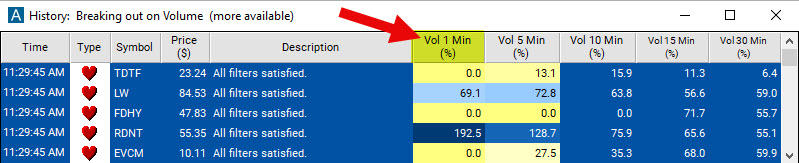
- Identifying Breakouts: A sudden surge in volume may indicate the start of a breakout, where the stock could make a significant move upward or downward. Let's say stock XYZ has an average daily volume of 1,000,000 shares over the last 10 trading days. A typical one-minute trading volume, given a standard trading day has 390 minutes, would in this case be 2,564 shares. If you see the Volume 1 Minute % Filter reporting a value of 400% or higher, this indicates that approximately 10,256 or more shares were traded in the last minute - a significantly higher volume than usual. This could be a signal of a potential breakout, and you might decide to buy shares if you anticipate an upward movement, or short sell the stock if you expect a downward trend.
- Spotting Reversals: The Volume 1 Minute % Filter can also be useful for identifying potential reversals. If a stock has been consistently moving in one direction with high volume, but you start seeing the volume decrease (below 100%) in the Volume 1 Minute % Filter, this could be a sign that the bullish trend is losing steam and a downward trend (reversal) could be on the horizon. This could be your cue to sell your shares or even initiate a short position.
- Analyzing Price and Volume Together: The Volume 1 Minute % Filter is a powerful tool, especially when used in conjunction with price analysis. A surge in volume accompanied by a significant price increase could signal strong buyer interest and a potential upward price movement. Conversely, a volume surge alongside a significant price drop could indicate strong selling pressure.
Remember that like all technical indicators, the Volume 1 Minute % Filter should be used in conjunction with other indicators and analysis methods for best results. No indicator can guarantee success, but using this filter effectively can certainly enhance your trading strategy and decision-making process. Let's consider some ways you might integrate this filter with other metrics:
- Volume 1 Minute Percent Filter and Moving Average Convergence Divergence (MACD):
MACD is a trend-following momentum indicator that shows the relationship between two moving averages of a security's price. Traders use MACD to identify potential buy and sell signals. If the Volume 1 Minute Percent Filter is showing an unusually high value (e.g., 300% or more), indicating a surge in trading volume, and the MACD line crosses above the signal line, this could be a bullish signal. Conversely, if the volume filter is high and the MACD line crosses below the signal line, it might suggest a bearish trend.
- Volume 1 Minute Percent Filter and Relative Strength Index (RSI):
RSI is a momentum oscillator that measures the speed and change of price movements on a scale from 0 to 100. It is used to identify overbought or oversold conditions in a market. When combined with the Volume 1 Minute Percent Filter, RSI can help validate volume surges. For instance, if the Volume 1 Minute Percent Filter indicates high trading volume and the RSI is above 70 (considered overbought), this could suggest a selling opportunity as the market might be due for a correction. On the other hand, a high volume coupled with an RSI below 30 (oversold) may indicate a buying opportunity.
- Volume 1 Minute Percent Filter and Bollinger Bands:
Bollinger Bands are a technical analysis tool defined by a set of trendlines plotted two standard deviations away from a simple moving average. A surge in volume shown by the Volume 1 Minute Percent Filter, combined with the stock price touching the upper Bollinger Band, could signal a selling opportunity, especially if other indicators confirm an overbought condition. Similarly, a surge in volume along with the price touching the lower Bollinger Band may be a sign to buy.
Remember, these strategies are only as effective as the broader analysis surrounding them. Always take into account other technical, fundamental, and market factors when making trading decisions. Using stop losses to manage risk is also crucial.
FAQs about Volume 1 Minute Percent
Why is the Volume 1 Minute % Filter not available in Top List Windows?
In the past, Top List Windows used to only update every few seconds, and due to this, some of the faster filters weren't available in Top Lists by default. You can, however, create a custom filter to see the 1 Minute Volume in % in your Top List Windows using the code [Vol1] in our Formula Editor. Once created, this custom filter will be select-able in your Top List Config Window, and can be used with min and max values just like the preset Volume 1 Minute % Filter. It will work exactly the same way.
How can I see the actual number of shares a stock has traded in the last minute, or scan for stocks based on the volume they traded in the last minute?
This data point is available for use in custom filters. To create a custom filter showing you the number of shares a stock has traded in the last minute, enter the code v_up_1 in the Formula Editor.
Once created and added to your scan, this custom filter can be used just like our preset filters. You can display it as a data column in any scan, or filter stocks based on the minimum and/or maximum number of shares they have traded in the last minute.
How can I catch stocks that have a volume spike from one minute to the next? For instance, I'm interested in identifying stocks experiencing a 2000% volume increase, like stock XYZ which traded 20,000 shares two minutes ago and then escalated to trading 400,000 shares in the last minute.
To pinpoint stocks with a sudden increase in trading volume from one minute to the next, you could employ a custom filter using this formula in the Formula Editor: (v_up_1/(v_up_2 - v_up_1))*100
Here's how it works:
-
v_up_1represents the volume in shares the last minute. -
v_up_2represents the volume in shares the last 2 minutes. -
The expression
v_up_2 - v_up_1then gives us the volume in the minute before the last minute. This is becausev_up_2includes both the last minute and the minute before that, so by subtractingv_up_1(the volume in the last minute), we are left with just the volume in the minute before the last minute. -
Multiplying the resulting ratio by 100 gives us the result as a percentage.
By adding this custom filter to your scan and entering 2000 in the minimum field of the Windows Specific Filters Tab, you would be able to catch stocks like XYZ.
Also check out our 1 Minute Volume Spike Alert.
Does the Volume 1 Minute % Filter look at the open or close of the candle?
The calculation for the Volume 1 Minute % Filter isn't influenced by the specific components of one-minute bars, such as the opening or closing points. Rather, this filter operates on a continuous time basis, assessing the trading volume in relation to exactly one minute in the past, irrespective of the candlestick charting. This means it is continually evaluating volume changes over rolling one-minute intervals, providing real-time insights beyond the static start and end points of individual candlesticks.
What could be causing extreme spikes as shown by the Volume 1 Minute Percent Filter?
Extreme spikes in the Volume 1 Minute Percent Filter often result from significant news events, earnings releases, or large trades by institutional investors. High volume can indicate strong investor interest and potential price volatility. However, it's important to look at the context: if the price is not moving significantly with high volume, it could indicate indecision in the market.
How can I incorporate the Volume 1 Minute Percent Filter into my existing trading strategy?
The Volume 1 Minute Percent Filter can be used as an additional layer of confirmation for your trading signals. For instance, if your strategy generates a buy signal, you may choose to only take the trade if the volume is above a certain threshold, suggesting strong buying interest.
How can I adjust the Volume 1 Minute Percent Filter for different market conditions?
You should remember to adjust the settings of your Volume 1 Minute Percent Filter based on different market conditions. For instance, during more volatile periods, you may wish to raise your minimum threshold to catch only the most extreme volume surges. Conversely, in quieter markets, lowering the threshold might provide more actionable signals.
How reliable is the Volume 1 Minute Percent Filter for detecting meaningful market activity?
Like any technical indicator, the Volume 1 Minute Percent Filter is not infallible and should not be used in isolation. It is most reliable when combined with other indicators and used as part of a comprehensive trading strategy. The key is to find combinations of filters and indicators that work best for your trading style and risk tolerance.
Always remember to factor in the broader market context, your overall trading strategy, and risk management principles when making trading decisions.
How can I use the Volume 1 Minute Percent Filter in short selling strategies?
For short selling strategies, you could use the Volume 1 Minute Percent Filter to identify potential overbought conditions that may precede a price drop. For instance, a very high filter value could indicate a rush of buyers, which might not be sustainable. If this surge is coupled with other indicators like an overbought RSI or a reversal candlestick pattern, it may suggest a good short selling opportunity.
How do the Volume 1 Minute % Filter and the Relative Volume Filter compare?
The Volume 1 Minute Percent Filter and the Relative Volume Filter are both useful tools for traders, and they serve slightly different purposes, so the choice between them depends on the specific needs of the trader.
Use the Volume 1 Minute Percent Filter when you want to monitor real-time changes in trading volume on an intraday basis. It's particularly useful if you're interested in trading during premarket hours, since the Relative Volume Filter does not work in the early morning session.
On the other hand, use the Relative Volume Filter when you want a more contextual view of the trading volume, comparing the current volume to the average volume for the same time of day. This is particularly useful for identifying shifts in market sentiment that might not be immediately apparent from the raw trading volume alone.
Filter Info for Volume 1 Minute [Vol1]
- description = Volume 1 Minute
- keywords = Fixed Time Frame
- units = %
- format = 1
- toplistable =
- parent_code =