


Volatility
Table of Contents
- Understanding the Volatility in Percent Filter
- Volatility in Percent Filter Settings
- Using Volatility in Trading
- FAQs about Volatility
Understanding the Volatility in Percent Filter
Volatility is a measure of how quickly a stock’s price typically changes. With the help of the Volatility Filters, you can either target or avoid stocks which typically move very quickly.
We always express volatility as the normal amount that a stock moves in a 15 minute period. We compute volatility based on the previous two weeks of historical data.
We use a proprietary formula for volatility. In particular, we expect stocks to move more around the open and the close than during lunch time. We expect stocks to move more on high volume days and we give less weight to what happens on low volume days.
The formula for the Volatility % Filter is: Volatility $/Current Stock Price*100
When you divide the volatility by the price, you're normalizing the volatility by the size of the price. This is useful because a $1 change for a $10 stock represents a much larger percentage change than a $1 change for a $100 stock.
By multiplying the result by 100, you convert the decimal into a percentage. This makes the number easier to understand and interpret.
So, this formula is essentially computing the average percentage price change for a given stock over the specified timeframe based on the historical data. This helps traders to understand how much, on average in percentage terms, a stock's price tends to move over that time-frame.
We chose 15 minutes as a baseline because many of our volume confirmed alerts look the best on a chart with 15 minute candles. We use this value everywhere, for consistency.
When a filter uses "bars" as units, this refers to the average amount that a stock’s prices moves between one 15 minute bar and the next.
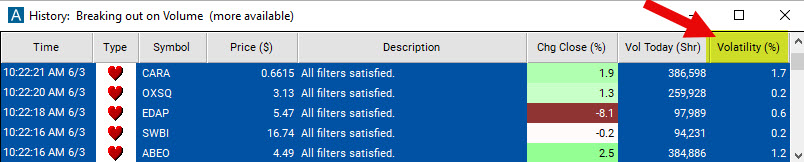
For a quick idea of what this means, just look at a stock chart with 15 minute bars, and see how much the price changes from the close of one bar to the close of the next. For a precise value, look up a stock in our stock screener.
Many of our alerts and filters automatically take volatility into account. If a stock has a higher volatility, it has to move more before we notice it. This is exactly the same as the example above, with the chart, except that our volatility formula is more precise.
Volatility in Percent Filter Settings
Activating the Volatility % Filter is straightforward. You'll find its settings under the Window Specific Filters Tab in your Alert/Top List Window's Configuration Window.
You can set a minimum and/or maximum value, and stocks that don't fit within your parameters are automatically excluded from your scan results.
-
To find stocks that typically move at least 3% every 15 minutes, add the Volatility % Filter to your scan and enter 3 in the minimum field in the Windows Specific Filters Tab.
-
To only see stocks which typically move no more than 20 basis points (0.2%) every 15 minutes, add the Volatility % Filter to your scan and enter 0.2 in the maximum field in the Windows Specific Filters Tab.
The Volatility % Filter enables you to define, what kind of typical volatility is acceptable to you. If you like stocks with generally high volatility, you define a higher minimum value. If you would like to avoid high volatility stocks, you define a lower minimum and maximum value.
Using Volatility in Trading
The Volatility Filter allows you to target stocks that align with your risk tolerance and trading strategy.
Many traders are scared off by volatility because of the complicated formulas. Don’t be. Most traders use volatility all the time, and aren’t even aware of it. When you look at a stock chart, and a stock moves up one inch, what does that mean? It depends on the chart! Most people draw a chart so that the highest price on the chart as at the top of the chart, and the lowest price is at the bottom. So an inch means more for a stock which typically moves more, a stock with a higher volatility.
FAQs about Volatility
What is the difference between the Volatility % Filter and the Change 15 Minute Filter?
Volatility provides you feedback about the typical move of a stock, whereas the Change in 15 Minute filter gives you feedback about the actual move of a stock.
In which way does the proprietary Trade Ideas Volatility Filter differ from the conventional calculation of volatility?
The conventional calculation of volatility often involves computing the standard deviation of daily price changes over a specific period, often months or years. So, calculating volatility using 15-minute price changes over two weeks is a shorter-term and more granular approach. It can capture intra-day volatility more effectively than the traditional method. The proprietary Trade Ideas Volatility Filter also gives more weight to high volume trading days and less to low volume days, whereas traditional volatility calculations are typically based on price changes alone, regardless of the volume of trading.
This proprietary approach might be more sensitive to transient market events and short-term fluctuations. While this might be advantageous for certain short-term trading strategies, it might not provide a comprehensive view of a stock's volatility from a long-term investment perspective.
Both methods have their use cases depending on the trading or investment strategy.
Does the Volatility Filter show me stocks that are currently volatile?
The volatility filter doesn't have the purpose of showing you stocks that are currently "volatile", it enables you to select stocks based on their general volatility.
Does the Volatility % Filter consider market news or only historical data?
The Volatility $ Filter is primarily based on historical price movement data over the past two weeks. While it does not directly account for market news, the impact of such news is typically reflected in a stock's price movements and trading volumes, which are taken into consideration by the filter.
Is it possible to use the Volatility % Filter in combination with other filters?
Absolutely, the Volatility % Filter can be used in conjunction with other filters to further refine your stock selection. For example, you could use it with a volume filter to find stocks that not only move within a desired range but also have significant trading volumes.
If I am a risk-averse trader, what settings should I use for the Volatility % Filter?
If you're risk-averse, you might prefer stocks that have lower volatility. In this case, you could set a low maximum value for the filter, say, 0.1%. This means you'd be looking at stocks which typically move no more than 10 basis points (0.1%) every 15 minutes, limiting your exposure to abrupt price changes.
How does the time of day impact the Volatility % Filter?
The proprietary formula for the Volatility % Filter expects stocks to move more around the market's open and close than during lunchtime. This means that the filter takes into account intraday trading patterns when determining a stock's volatility.
Can I use the Volatility $ Filter to gauge market volatility?
The Volatility % Filter is primarily designed to measure individual stock's typical volatility rather than current overall market volatility. However, our Beta Filter might be of interest to you. Beta is a measure of the volatility of a given stock relative to the overall market, usually the S&P 500. Beta describes the sensitivity of an instrument to broad market movements. A beta above 1 is more volatile than the overall market, while a beta below 1 is less volatile. Securities with betas of zero generally move independently of the overall market. And finally, stocks with negative betas tend to move in the opposite direction relative to the broader market.
What is the difference between implied volatility and this historical or realized volatility filter?
Implied volatility is a metric that reflects the market's expectation of future volatility. It is often used in the pricing of options and is derived from the market price of an option. If the price of an option increases, all else being equal, implied volatility is also considered to increase. High implied volatility generally indicates that the market anticipates significant price movement, while low implied volatility suggests that the market expects relatively stable prices. It's essential to understand that implied volatility isn't directly related to a stock itself, but to the options on the stock.
Because options prices are affected by market participants' views about future stock price movements, implied volatility can be seen as the market's aggregate expectation of future stock price volatility.
Implied volatility is different from the volatility discussed here in several ways:
- Timeframe: Historical volatility measures past price fluctuations, over a period of days, weeks, or months. Implied volatility, on the other hand, is forward-looking, representing the market's expectation of future volatility over the life of the option.
- Source of data: Historical volatility is calculated based on past price changes of the underlying asset (stock, commodity, etc.), while implied volatility is derived from the market price of an option.
- Use: Historical volatility is often used in trading strategies to filter stocks based on their past price fluctuations, as discussed above. On the other hand, implied volatility is crucial for options pricing and is often used by options traders to determine whether an option is overpriced or underpriced relative to the market's expectation of future volatility.
- Prediction capability: Implied volatility represents market expectations and can potentially provide information about upcoming events or changes. Historical volatility, however, only tells you about what has already occurred and does not necessarily predict future volatility.
Are there other forward-looking measures of volatility?
The volatility index, often referred to by its ticker symbol VIX, is another forward-looking measure of volatility. It measures implied volatility over the next 30 days in the S&P 500 index options and is sometimes called the "fear gauge" because it tends to rise when market uncertainty and fear increase.
Remember, these are still just estimations or expectations of future volatility. The actual future volatility of a stock or the stock market as a whole can only be known in hindsight. Therefore, while implied volatility and indices like the VIX can provide valuable insights, they should be used in conjunction with other tools and analyses in a comprehensive trading or investment strategy.
Filter Info for Volatility [VWVP]
- description = Volatility
- keywords = Changes Daily
- units = %
- format = 1
- toplistable = 1
- parent_code = VWV