


Consecutive Candles
Table of Contents
- Understanding the Consecutive Candle 5 Minute Filter
- Consecutive Candle 5 Minute Filter Settings
- Using the Consecutive Candle 5 Minute Filter
- FAQs
Understanding the Consecutive Candle 5 Minute Filter
A consecutive candle filter is a technical analysis tool used to identify patterns in price movements on a stock chart. Specifically, it focuses on consecutive candles, which are successive periods on a price chart where the price of the asset has moved in the same direction (e.g., up or down) without interruption.
Definition of Consecutive Candles: Traders define the criteria for what constitutes a consecutive candle. For example, they may specify that there must be at least two or three consecutive candles moving in the same direction to trigger the filter.
This filter looks at a standard intraday candlestick chart to see if the stock price has been moving up recently, and if so, for how long. This specific filter is used on a 5-minute candlestick chart.
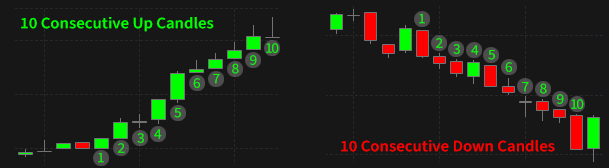
This filter is similar to the up days filter, but the definition is slightly different. For an intraday chart, a candle is called an “up candle” if the high of the candle is higher than the high of the previous candle and the low of this candle is higher than the low of the previous candle. If a candle has a lower high than the previous candle, and a lower low than the previous candle, then we call it a “down candle.”
This filter only looks at complete candles.
We use negative numbers to represent down candles. If you set the max value to -2, then this filter will look for stocks where the last two candles were both down candles. 0 means that the most recent candle was neither an up candle nor a down candle.
As with all of our analysis of traditional candlesticks, we only update these filters during market hours. And if a stock has an empty candle, we don’t look any past that candle.
Consecutive Candle 5 Minute Filter Settings
The settings of each Trade Ideas filter are defined in the Window Specific Filters Tab located in the Configuration Window of your Alert/Top List Window.
-
Positive numbers represent green candles.
-
Negative numbers represent red candles.
-
If you want to see stocks with 3 or more consecutive green candles, enter 3 into the minimum field.
-
If you want to see stocks with 3 or more consecutive red candles, enter -3 into the maximum field.
Using the Consecutive Candle 5 Minute Filter
The consecutive candle filter can be used in conjunction with various trading strategies to identify potential opportunities in the market. Here are some strategies that traders commonly employ with the consecutive candle filter:
Trend Reversal Confirmation: Traders use the consecutive candle filter to confirm potential trend reversals. For example, if there is a prolonged downtrend and the consecutive candle filter identifies a series of upward candles, it may indicate a reversal in the trend. Traders may then look for confirmation signals before entering a trade in the opposite direction.
Breakout Trading: Breakout traders use the consecutive candle filter to identify breakout opportunities. They look for instances where the price breaks out of a trading range or consolidates pattern with a series of consecutive candles moving in the same direction. This can signal a strong momentum move, and traders may enter a trade in the direction of the breakout.
Pullback Trading: Pullback traders utilize the consecutive candle filter to identify pullback opportunities within an existing trend. After a strong move in the direction of the trend, traders look for a series of consecutive candles moving against the trend, indicating a temporary retracement. They may then enter a trade in the direction of the overall trend once the pullback is complete.
Range Trading: Range traders use the consecutive candle filter to identify trading opportunities within a defined price range. They look for a series of consecutive candles oscillating between support and resistance levels, indicating a period of consolidation. Traders may then enter long or short trades at the support or resistance levels, respectively, with the expectation that the price will continue to range within the defined boundaries.
Pattern Recognition: Traders use the consecutive candle filter to identify specific chart patterns, such as flags, pennants, or triangles, which are formed by consecutive candles. These patterns can provide valuable insights into future price movements and potential trade setups.
Volatility Breakouts: Traders use the consecutive candle filter to identify periods of heightened volatility. They look for a series of consecutive candles with large price ranges, indicating increased market activity. Traders may then enter trades in the direction of the breakout, expecting the volatility to continue.
FAQs
What time frame should I use for the consecutive candle filter?
- Traders may wonder which time frame is most suitable for the consecutive candle filter. The answer depends on their trading style and objectives. Short-term traders may prefer lower time frames, such as 1-minute or 5-minute charts, while swing traders may use higher time frames, such as 1-hour or daily charts. It's essential to experiment and find the time frame that aligns best with your trading strategy.
How many consecutive candles should I look for before considering a signal?
- Determining the optimal number of consecutive candles depends on the trader's preferences and the specific market conditions. Some traders may require at least two or three consecutive candles to validate a signal, while others may prefer more significant patterns, such as five or six consecutive candles. It's essential to backtest different scenarios and adjust the criteria based on historical performance and risk tolerance.
Should I use the consecutive candle filter as a standalone indicator or in combination with other tools?
- While the consecutive candle filter can be a useful tool for identifying potential trading opportunities, it's often more effective when used in conjunction with other technical indicators or trading strategies. Combining the consecutive candle filter with tools such as moving averages, Bollinger Bands, or Fibonacci retracements can provide additional confirmation and enhance the reliability of signals.
Filter Info for Consecutive Candles [Up5]
- description = Consecutive Candles
- keywords = Fixed Time Frame Price vs Time
- units = 5 minute candles
- format = 0
- toplistable = 1
- parent_code = Up1