


Today's Range
Table of Contents
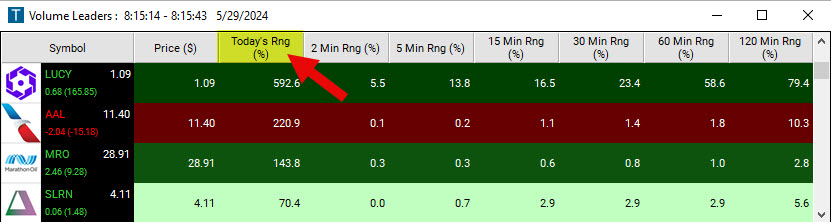
- Understanding the Todays Range in Percent Filter
- Todays Range in Percent Filter Settings
- Using the Todays Range in Percent in Trading
- FAQs about Todays Range in Percent
Understanding the Todays Range in Percent Filter
The Daily Range of a stock is calculated by subtracting the day's low from the day's high. The Today's Range % Filter enables you to compare this daily range of a stock to its Average True Range.
The formula of this filter is: ((t_high-t_low)/average_true_range*100)
This filter work from the official highs and lows of the day, which typically don't update after the market closes.
The Daily Range % Filter won't give you any pre-market insights. So until the market opens and the high and low prices of the day are established, it's a waiting game.
Todays Range in Percent Filter Settings
Activating the Today's Range (%) Filter is straightforward. You'll find its settings under the Window Specific Filters Tab in your Alert/Top List Window's Configuration Window.
You can set a minimum and/or maximum value, and stocks that don't fit within your parameters are automatically excluded from your scan results.
-
To find stocks with a range that is at least twice as broad today as on an average day, add the Today's Range (%) Filter to your scan and enter 200 in the minimum field in the Windows Specific Filters Tab.
-
To find stocks with a range today of no more than half their average range, add the Today's Range (%) Filter to your scan and enter 50 in the maximum field in the Windows Specific Filters Tab.
Please note: Today’s range is meaningless before the market opens. If you define minimum and/or maximum values for this filter in a premarket scan, you will not get any results in the pre-market.
Using the Todays Range in Percent in Trading
The Daily Range % Filter tells a trader in real-time how today's range of a stock compares to its average range. This information can be useful in several ways:
- Spot Potential Breakouts: If a stock's daily range exceeds its Average True Range (ATR) significantly, it could suggest a breakout from a previously established trading range. Traders could use this information to initiate trades betting on the continuation of the breakout. On the other hand, if a stock has already reached its Average True Range on a normal day, a trader could also assume that it's unlikely to move much further.
- Reversion to the Mean: On the other hand, if a stock has already reached its Average True Range (ATR) on a normal day, a trader could assume that it's unlikely to move much further. In this scenario, a trader may consider initiating trades betting on the price reverting back towards the mean (average). This is based on the assumption that price tends to return to its average over time, especially when it has already reached its typical range for the day. This trading technique can be particularly effective in a stable market where prices are not subject to strong trends or volatility.
- Analyze Trend Strength: By looking at changes in the daily range in conjunction with volume, traders can get an idea of the strength of a trend. If both volume and the daily range are increasing, it could suggest a strong trend. Conversely, an increasing daily range with decreasing volume might indicate a weakening trend.
- Finding Volatility: A daily range that represents a multiple of an average true range, means the stock is more volatile. Active traders love volatility! It's where the money is.
- Find Anomalies: If a stock's range for the day is significantly different from its ATR, it could suggest some anomaly or event driving the price. Traders could use this information to investigate what's causing the unusual price behavior and potentially capitalize on it.
- Use with Timeframes: Consider varying the trading timeframes. For instance, compare the daily range percentage with ranges over longer periods, such as weekly or monthly.
- Use in Sector Analysis: Utilize the filter for sector analysis. By scanning different sectors with the filter, you can quickly identify which sectors are experiencing greater than average volatility.
While the 'Today's Range in Percent' filter can be a powerful tool, it's important to use it in conjunction with other technical analysis tools and indicators to confirm any signals it might provide. It should be part of a larger, comprehensive trading strategy.
FAQs about Todays Range in Percent
How does the Average True Range (ATR) impact the results of the Today's Range % Filter?
The Average True Range (ATR) is a key component in the calculation of the Today's Range % Filter. It represents the average of the true ranges over a specific period. When using the Today's Range % Filter, the daily range of a stock (high-low) is divided by the ATR and multiplied by 100 to get a percentage. This percentage allows you to compare the volatility of different stocks, regardless of their price. A high percentage indicates that the stock's current volatility is high compared to its average level, which can signal potential trading opportunities.
What is the ideal value to set for the minimum and maximum fields in the Today's Range % Filter?
The ideal values to set for the minimum and maximum fields in the Today's Range % Filter will largely depend on your trading style and risk tolerance. For instance, if you are a momentum trader looking for high volatility stocks, you might set a high minimum value to filter out stocks with low volatility. Conversely, if you are a conservative trader looking to avoid highly volatile stocks, you might set a low maximum value. It's important to adjust these settings based on your trading objectives and market conditions.
Why doesn't the Today's Range % Filter provide any pre-market insights?
The Today's Range % Filter doesn't provide pre-market insights because it's based on the official high and low prices of the day, which are only established once the market opens and trades start to occur. It's important to note that pre-market trading tends to have lower liquidity and can be more volatile, which might not accurately reflect the stock's typical trading conditions.
How does the Today's Range % Filter help in identifying anomalies in the market?
The Today's Range % Filter helps in identifying anomalies by comparing the current day's range to the stock's Average True Range (ATR). If a stock's range for the day is significantly different from its ATR, it could indicate unusual trading activity, possibly due to a news event or a sudden change in market sentiment. This could provide an opportunity for traders to capitalize on the unusual price behavior.
What are some potential limitations of the Today's Range % Filter?
The Today's Range % Filter does not provide insights into the direction of price movements. It only provides information about the extent of price movements. It also doesn't give any pre-market insights and works from the official highs and lows of the day, which typically don't update after the market closes. Therefore, it needs to be used in conjunction with other technical and fundamental analysis tools for a more complete picture.
Is there a way to compare Yesterday's Range to a stock's Average True Range?
You can easily create a custom filter to compare Yesterday's Range to the ATR, using the following formula in our Formula Editor:
((high_p-low_p)/average_true_range*100)
Filter Info for Today's Range [TRangeP]
- description = Today's Range
- keywords =
- units = %
- format = 1
- toplistable = 1
- parent_code = TRangeD