


10 Day Range
Table of Contents
- Understanding the 10 Day Range in Dollar Filter
- 10 Day Range in Dollar Filter Settings
- Using the 10 Day Dollar Range in Trading
- FAQs about 10 Day Range in Dollars
Understanding the 10 Day Range in Dollar Filter
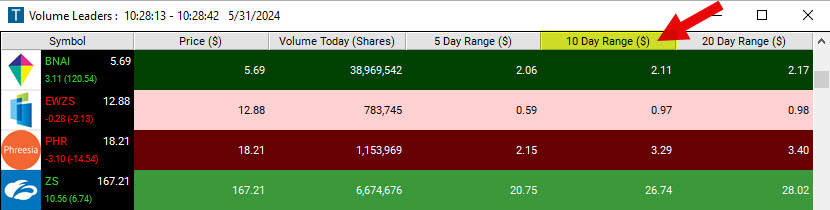
The 10 Day Range in Dollar Filter returns the difference between the highest and lowest prices a stock has traded within the previous 10 days. It does not count the current day’s prices.
The exact formula is: high_10d-low_10d
As an example, if the lowest price for a stock in the previous 10 days was $9, and the highest price was $16, then the trading range would be $7.
10 Day Range in Dollar Filter Settings
Activating the 10 Day Range ($) Filter is straightforward. You'll find its settings under the Window Specific Filters Tab in your Alert and Top List Configuration Window.
You can set a minimum and/or maximum value, and stocks that don't fit within your parameters are automatically excluded from your scan results.
-
To find stocks with a 10-Day Range of at least $4.60, add the 10 Day Range ($) Filter to your scan and enter 4.6 in the minimum field in the Windows Specific Filters Tab.
-
To find stocks with a 10-Day Range of no more than $9.90, add the 10 Day Range ($) Filter to your scan and enter 9.9 in the maximum field in the Windows Specific Filters Tab.
-
To find stocks with a 10-Day Range between $2.45 and $7.95, add the 10 Day Range ($) Filter to your scan and enter 2.45 in the minimum field and 7.95 in the maximum field in the Windows Specific Filters Tab.
Using the 10 Day Dollar Range in Trading
The 10 Day Range in Dollar Filter is a useful tool for traders, particularly those employing strategies that capitalize on volatility or range-bound markets. Here's how traders might use this filter in their strategies:
- Identifying volatile stocks for short-term trades: Traders interested in short-term, high-risk trading such as day trading or swing trading can use this filter to identify stocks that have exhibited significant price movement over the past 10 days. By setting a high minimum value, traders can find stocks that have a wide range and are therefore potentially volatile.
- Identifying range-bound stocks for swing trading: The filter can also be used to identify stocks that have been trading within a certain range. By setting both a minimum and maximum value, traders can find stocks that are not too volatile but still exhibit enough price movement for profitable swing trades. Once identified, the trader can then use other analysis techniques to determine the best entry and exit points within the stock's trading range.
- Excluding overly volatile or flat stocks from scans: If a trader is looking for stable, moderately volatile stocks for a longer-term investment strategy, they could use this filter to exclude stocks that are too volatile or have little to no movement. Setting a maximum value would exclude stocks with high volatility, while setting a minimum value would exclude flat stocks.
- Sector comparison: Traders can also use this filter to compare the volatility of different sectors. By running scans for stocks within specific sectors and comparing the results, traders can identify which sectors are currently the most volatile. This information can be useful for sector-based strategies.
- Filtering stocks for other strategies: The 10 Day Range in Dollar Filter can be used in combination with other filters and indicators to refine other trading strategies. For instance, a momentum trader might first use a momentum filter to identify trending stocks, then use the 10 Day Range in Dollar Filter to further narrow down their options to stocks that are trending within a specific price range.
FAQs about 10 Day Range in Dollars
Does the 10 Day Range in Dollar Filter include the current day's prices?
No, the filter only considers the highest and lowest prices a stock has traded at within the previous 10 days. It does not count the current day's prices. This is designed to ensure that the filter provides a consistent measure of a stock's recent trading range, unaffected by intraday volatility.
What if I'm not interested in the dollar amount of the 10 Day Range and would like to see it in percentage terms?
While the 10 Day Range in Dollar Filter specifically measures the range in dollar terms, you could alternatively use our Range 10 Days (%) Filter which calculates the range in percentage terms.
Can I adjust the time frame from 10 days to something else?
The 10 Day Range in Dollar Filter specifically looks at the past 10 trading days, and this time frame is not customizable, but we do have the following additional daily time frames available: Today's Range ($) Filter, Range 5 Days ($) Filter, Range 20 Days ($) Filter.
To see the yearly range, simply created the following custom filter in our Formula Editor: high_52w-low_52w
To see the lifetime range, simply created the following custom filter in our Formula Editor: high_life-low_life
How does the 10 Day Range in Dollar Filter compare to other volatility measures?
As discussed above, the 10 Day Range in Dollar Filter provides a simple snapshot of a stock's recent price fluctuation. It does so by comparing the highest and lowest prices a stock has traded within the previous 10 days. It's a straightforward method to get a sense of recent price movements, but it does not account for the direction of price movements, the frequency of price changes, or expected future volatility.
The ATR is an indicator that measures market volatility by calculating the average range between the high and low prices over 14 days. ATR considers gaps and limit moves and includes these in the calculation, hence providing a more comprehensive measure of volatility.
Our proprietary volatility filter takes into account several factors including the timing of trading (expecting more movement around market open and close), trading volume, and typical movement over a 15-minute period based on historical data from the previous two weeks.
The Volatility Filter is likely to provide a more sensitive and potentially more accurate indication of short-term volatility than either the 10 Day Range in Dollar Filter or the ATR. It's likely most useful for short-term trading strategies, especially those that involve frequent trades around market open and close. By considering volume, it can adjust for days when abnormal trading might distort a simpler measure of volatility.
This filter is a measure of how much a stock's price deviates from its mean price over a year, with more recent data given more weight. It represents the average amount the stock's price fluctuates in a day based on past performance.
By giving more weight to recent values, this filter can provide a more current representation of a stock's volatility. However, because it's based on a longer timeframe (a year of daily candles), it might not capture very recent changes in volatility as quickly as the 10 Day Range in Dollar Filter.
All four of these measures provide different views of volatility and may be useful in different contexts. The 10 Day Range in Dollar Filter is the simplest and most straightforward but provides the least detail.
Filter Info for 10 Day Range [Range10D]
- description = 10 Day Range
- keywords = Fixed Time Frame
- units = $
- format = p
- toplistable = 1
- parent_code = Range5D