


Position in 10 Day Range
Table of Contents
- Understanding the Position in 10 Day Range Filter
- Position in 10 Day Range Range Filter Settings
- Using the Position in 10 Day Range Filter
- FAQs
Understanding the Position in 10 Day Range Filter
The "position in 10-day range" filter is used to evaluate where the current price of a stock stands relative to its price range over the past ten trading days. This filter helps traders assess the recent price movement of a stock and identify potential trading opportunities based on its position within this range.
Here's how the "position in 10-day range" filter works:
Calculation of 10-Day Range: The filter calculates the price range of the stock over the past ten trading days. This range typically spans from the lowest price (low) to the highest price (high) traded during this period.
Position Calculation: Next, the filter determines the position of the current price within the 10-day range. This calculation is expressed as a percentage, indicating how far the current price is from the lowest or highest price of the past ten days.
This uses the same scale as the other position in range filters. 0% means that the stock is currently trading at the lowest price that it has traded in the previous 10 days. 100% means that the stock is trading at the highest price of that time frame.
This filter is similar to the Position in Previous Day’s range filter, because it does not look at today’s data when they calculate the range. If the current stock price is $10, and the highest price in the previous 10 days was $9, then the value of this filter will be above 100%. If the current price is less than the lowest price of the last 10 days, then this filter will have a negative value.
The current price is based on the last print. There is no smoothing or averaging. These filters update before, during, and after market hours.
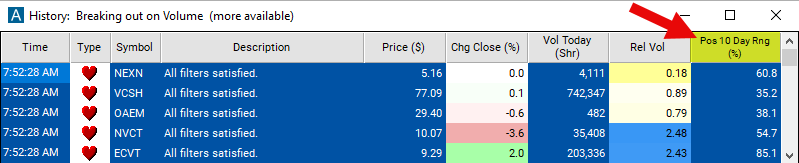
The column for this scan will be displayed as a graphical indicator. To view the percentage, simply right-click on the column and deselect the option labeled "Graphical Indicator."
If you opt to utilize the graphical indicator, here's a brief overview of the various types of graphics and their corresponding meanings:
 =
= 
 =
= 
 =
= 
Position in 10 Day Range Range Filter Settings
The settings of each Trade Ideas filter are defined in the Window Specific Filters Tab located in the Configuration Window of your Alert/Top List Window.
Here is how to setup the filter in your configuration window:
- Set the minimum value to 25 to see stocks which are at least 25% above the low of its 10 day range.
Using the Position in 10 Day Range Filter
Several trading strategies can be employed with the Position in 10 Day Range filter. Here are a few examples:
Breakout Trading: Traders can identify stocks that are trading near the high or low of the 10-day range. If the price breaks out above the high of the range, traders may consider entering long positions, anticipating further upward momentum. Conversely, if the price breaks below the low of the range, short positions might be taken, expecting downward continuation.
Trend Confirmation: This strategy involves using the position in the 10-day range filter to confirm the strength of an existing trend. If the price remains consistently near the high or low of the 10-day range during an uptrend or downtrend, respectively, it may indicate the trend's continuation. Traders may consider entering positions in the direction of the trend based on this confirmation.
Reversal Trading: Contrarian traders can look for stocks that have deviated significantly from the high or low of the 10-day range, indicating potential overbought or oversold conditions. If the price shows signs of reversal near the high or low of the range, such as bearish or bullish candlestick patterns, traders may enter positions anticipating a reversal back toward the mean.
FAQs
What does the "position in 10-day range" filter indicate?
- This filter indicates the current position of a stock's price within its price range over the past ten trading days. It helps traders assess whether the current price is closer to the high or low of the recent price range, providing insights into recent price momentum.
Can the "position in 10-day range" filter be used for both short-term and long-term trading strategies?
- Yes, the filter can be used for both short-term and long-term trading strategies. Short-term traders may use it to identify intraday or swing trading opportunities based on recent price momentum, while long-term traders may use it to assess the overall trend direction.
How should traders interpret different positions within the 10-day range?
- Traders may interpret a position closer to the high of the 10-day range as indicating bullish momentum or buying pressure, while a position closer to the low may suggest bearish sentiment or selling pressure. However, interpretation may vary based on other factors such as volume and news catalysts.
How reliable is the "position in 10-day range" filter for making trading decisions?
- Like any technical indicator, the reliability of the filter depends on various factors such as market conditions and the validity of other analysis techniques. Traders should use it in conjunction with other indicators and analysis methods for informed trading decisions.
Filter Info for Position in 10 Day Range [R10D]
- description = Position in 10 Day Range
- keywords = Single Print
- units = %
- format = 1
- toplistable = 1
- parent_code = R5D