


Average Number Of Prints
Table of Contents
- Understanding the Average Number of Prints Filter
- Average Number of Prints Filter Settings
- Using the Average Number of Prints in Trading
- FAQs about Average Number of Prints
Understanding the Average Number of Prints Filter
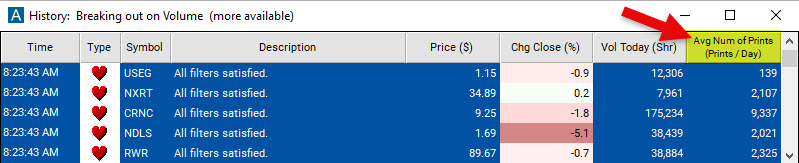
The Average Number of Prints Filter looks at the number of prints a stock has on an average day, based on recent history (not today’s trading).
Prints refers to the number of times a stock has been traded or the number of transactions executed for that stock.
For information on the number of prints in the last few minutes, look at our dedicated Unusual Number of Prints Alert.
Average Number of Prints Filter Settings
The settings of each Trade Ideas filter are defined in the Window Specific Filters Tab located in the Configuration Window of your Alert/Top List Window.
The Average Number of Prints Filter works by setting a minimum and/or maximum value. Stocks that fall outside of this range will be excluded from the scan results.
To find stocks that have an average number of prints of 10,000 per day, add the Average Number of Prints Filter to your scan and enter 10000 in the minimum field in the Windows Specific Filters Tab.
Using the Average Number of Prints in Trading
The average number of prints a stock has per day can be a useful indicator of liquidity for a trader. Liquidity is important for traders because it allows them to enter and exit trades quickly and easily. If a stock has few transactions, then it may be difficult to trade because there may not be enough buyers or sellers to match the trader's order.
The average number of prints per day is not a perfect indicator of liquidity, it is important to consider other factors, such as the stock's price and volatility, when using the average number of prints per day to make trading decisions.
FAQs about Average Number of Prints
What is the difference between shares traded and prints?
In stock trading, the terms shares traded and prints refer to slightly different concepts, although they both relate to the volume of trading activity. Here's an explanation of the difference between these two terms:
-
Shares Traded: "Shares traded" refers to the total number of shares of a particular stock that have been bought or sold during a given period of time, such as a trading day or a specific time interval. It represents the actual quantity of shares exchanged between buyers and sellers in the market. For example, if 1,000 shares of a stock are bought and 500 shares are sold during a trading day, the total shares traded would be 1,500 shares.
-
Prints: "Prints" are individual recorded transactions or trades that occur in the market. Each time a buy or sell trade is executed and recorded, it is considered a print. Prints represent the discrete instances of buying or selling activity in the market. For instance, if there are five trades executed in a stock during a specific time period, there would be five prints recorded. Each print captures the price, quantity, and timestamp of the trade.
In summary, "shares traded" refers to the cumulative quantity of shares bought or sold, while "prints" represent the individual recorded instances of trading activity. The term "prints" is often used to analyze the distribution, timing, and characteristics of the trades, providing insights into the patterns and dynamics of market activity.
Why would a trader look at average number of prints (transactions) per day rather than the actual shares traded?
There are a few reasons why a trader might look at the average number of prints (transactions) per day rather than the actual shares traded.
Prints are a more granular measure of trading activity. Shares traded is a cumulative measure of the total number of shares that have been bought or sold, while prints represent the individual recorded instances of trading activity. This means that prints can provide a more detailed view of the trading activity in a stock, which can be helpful for traders who are trying to identify trends or patterns.
Prints are less susceptible to manipulation. The number of shares traded can be manipulated by large institutions who buy or sell large blocks of shares at the same time. This can distort the true level of liquidity in a stock. However, prints are less susceptible to manipulation because they represent the individual transactions that take place in the market.
Overall, the average number of prints per day can be a useful tool for traders who are looking for a more granular measure of trading activity. However, it is important to be aware of the limitations of this metric and to use it in conjunction with other factors when making trading decisions.
Do you have a filter that counts the number of transactions in a 1-Minute Period (or any other intraday time period)?
To provide this data intraday would require Time and Sales/Level2, and at this point we only provide Level 1 data. Therefore, we currently don't have a filter for the number of transactions/trades. We, however, have the Unusual Number of Prints Alert and the Block Trade Alert.
Filter Info for Average Number Of Prints [Prints]
- description = Average Number of Prints
- keywords = Changes Daily
- units = Prints / Day
- format = 0
- toplistable = 1
- parent_code =