


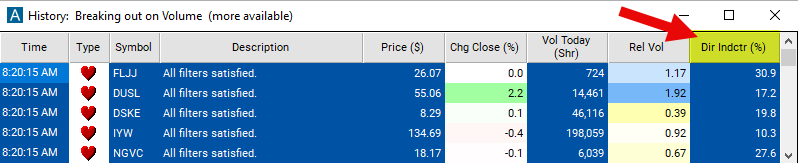
Directional Indicator
Table of Contents
- Understanding the Directional Indicator Filter
- Directional Indicator Filter Settings
- Using the Directional Indicator Filter
- FAQs
Understanding the Directional Indicator Filter
The Directional Indicator (DI) filter is a tool used in technical analysis for evaluating the direction of a given stock or market's price movement. It includes two primary components: the Positive Directional Indicator (+DI) and the Negative Directional Indicator (-DI). Here's a detailed explanation of how it works and how it's used in stock trading:
Components of the Directional Indicator Filter
-
Positive Directional Indicator (+DI): Measures the presence of an upward price movement and its strength relative to previous periods. It's calculated based on the difference between the current high and the previous high, indicating bullish pressure when it's increasing.
-
Negative Directional Indicator (-DI): Measures the presence of a downward price movement and its strength relative to previous periods. It's calculated from the difference between the previous low and the current low, indicating bearish pressure when it's increasing.
How It Works
Calculation: The +DI and -DI are derived from the Directional Movement Index (DMI), which itself is part of the calculations involving the True Range and the directional movements (+DM and -DM). The +DI and -DI are then smoothed over a specified period and normalized by dividing them by the Average True Range (ATR), presenting them as a percentage.
Interpretation: When the +DI is above the -DI, it suggests that buying pressure is dominating and the market could be in an uptrend.
Conversely, when the -DI is above the +DI, selling pressure is dominant, indicating a potential downtrend. The greater the distance between the +DI and -DI, the stronger the trend. A crossover of these lines can signal potential buying or selling opportunities.
This filter can be anywhere between -100 and 100.
Directional Indicator Filter Settings
The settings of each Trade Ideas filter are defined in the Window Specific Filters Tab located in the Configuration Window of your Alert/Top List Window.
Here is how to setup the filter in your configuration window:
- To find stocks that are going up, set the minimum value for this filter to 0.
- To find stocks that are going down, set the maximum value for this filter to 0.
- To find stocks where +DI is noticibly higher than -DI, set the min value to 10.
- To find stocks where +DI is noticibly lower than -DI, set the max value to -10.
Using the Directional Indicator Filter
Several trading strategies can be employed with the Directional Indicator filter. Here are a few examples:
DI Crossover Strategy: Buy when the +DI crosses above the -DI, indicating potential upward momentum. Conversely, sell or short when the -DI crosses above the +DI, signaling potential downward momentum.
Trend Strength Confirmation with ADX: Use the ADX in conjunction with the +DI and -DI to confirm the strength of the trend before making a trade. Consider trading in the direction indicated by the DI crossover only when the ADX is above a certain level (e.g., 20 or 25), which signifies a strong trend.
DI Divergence Strategy: Look for divergence between the DI lines and price. For example, if price makes a new high but the +DI does not, it may indicate weakening upward momentum and a potential reversal.
FAQs
What do the +DI and -DI indicate in trading?
- The Positive Directional Indicator (+DI) measures the presence and strength of upward price movement, while the Negative Directional Indicator (-DI) measures the presence and strength of downward price movement. When +DI is above -DI, it suggests that buying pressure is stronger than selling pressure, indicating a potential uptrend. Conversely, when -DI is above +DI, selling pressure is dominant, suggesting a potential downtrend.
How do I use DI crossovers to make trading decisions?
- DI crossovers can serve as trading signals. A crossover of +DI above -DI may signal a buying opportunity, indicating an emerging uptrend. On the other hand, a crossover of -DI above +DI may signal a selling or shorting opportunity, indicating an emerging downtrend. It's crucial to consider other factors and indicators for confirmation to reduce false signals.
How does the ADX work with the +DI and -DI indicators?
- The Average Directional Index (ADX) works in tandem with the +DI and -DI indicators by measuring the strength of a trend. While +DI and -DI indicate the trend direction, the ADX quantifies how strong the trend is. A rising ADX, especially above a value of 25, suggests a strong trend, enhancing the significance of the DI crossover signals.
Filter Info for Directional Indicator [PDIMDI]
- description = Directional Indicator
- keywords = Changes Daily
- units = %
- format = 1
- toplistable = 1
- parent_code =