Change in 1 Year
Table of Contents
- Understanding the Change in 1 Year Percent Filter
- Change in 1 Year Percent Filter Settings
- Using the Change in 1 Year Percent Filter
- FAQs
Understanding the Change in 1 Year Percent Filter
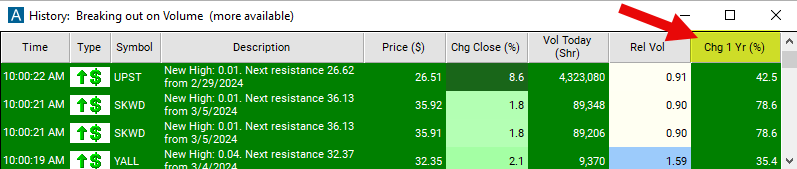
The "change in 1 year (%)" filter compares the current price to the price 1 year ago, measured in percentage. Traders and investors may use this filter to identify stocks that have experienced significant price movements over the past year, which could indicate potential trends or opportunities for further analysis. It can also help them understand the volatility and overall performance of a stock within a specific timeframe.
The formula for the % version is (new value – old value) / old value * 100.
The current price is based on the last print. There is no smoothing or averaging. This updates before, during, and after market hours.
Change in 1 Year Percent Filter Settings
The settings of each Trade Ideas filter are defined in the Window Specific Filters Tab located in the Configuration Window of your Alert/Top List Window.
Here is how to setup the filter in your configuration window:
- Set the min value to 25 to see stocks which are up at least 25% from 1 year ago.
Using the Change in 1 Year Percent Filter
Several trading strategies can be employed with the Change in 1 Year Percent filter. Here are a few examples:
Volatility Trading: Stocks with high changes in 1 year (%) may indicate high volatility in price movements. Traders specializing in volatility trading may look for opportunities to profit from short-term price fluctuations. They may employ strategies such as options trading or volatility ETFs to capitalize on the volatility.
Trend Following: Traders can use the change in 1 year (%) filter as part of a trend-following strategy. Stocks with consistent positive percentage changes over the past year may indicate strong uptrends, while those with consistent negative percentage changes may indicate downtrends. Traders may consider entering long positions in stocks with upward trends and short positions in stocks with downward trends.
Pairs Trading: Traders may use the change in 1 year (%) filter to identify pairs of stocks with divergent price movements over the past year but are otherwise similar in fundamentals or industry. They may then enter pairs trades, simultaneously buying the relatively stronger stock and selling short the relatively weaker stock, aiming to profit from the convergence of their prices.
FAQs
What does the "change in 1 year (%)" filter signify?
- This filter indicates the percentage change in a stock's price over the past year. It helps traders understand the magnitude of price movements within a specific timeframe relative to the stock's initial price.
How should I interpret high or low values in the "change in 1 year (%)" filter?
- A high positive percentage indicates that the stock's price has risen significantly over the past year, while a high negative percentage suggests a substantial decline. Conversely, low values indicate minimal price movement.
Can the "change in 1 year (%)" filter be used as the sole basis for trading decisions?
- While the filter provides valuable information, it should be used alongside other technical and fundamental analysis tools. Relying solely on this filter may not provide a comprehensive view of market conditions.
Should I consider stocks with extreme percentage changes?
- Extreme percentage changes may indicate high volatility, which can present both opportunities and risks. Traders should conduct thorough analysis and consider risk management strategies before trading stocks with extreme percentage changes.
Filter Info for Change in 1 Year [UYP]
- description = Change in 1 Year
- keywords = Single Print
- units = %
- format = 1
- toplistable = 1
- parent_code = UYD