Position in Previous Day's Range
Table of Contents
- Understanding the Position in Previous Days Range Filter
- Position in Previous Days Range Filter Settings
- Using the Position in Previous Days Range Filter
- FAQs
Understanding the Position in Previous Days Range Filter
The "position in previous days range" filter is used to evaluate where the current price of a stock stands relative to its price range on the previous trading day. This filter helps traders assess the strength or weakness of the current price movement within the context of recent trading activity.
Here's how the "position in previous days range" filter works:
Calculation of Previous Day's Range: The filter first calculates the price range of the previous trading day. This range typically spans from the highest price (high) to the lowest price (low) traded during that day.
Position Calculation: Next, the filter determines the position of the current price within the range of the previous day. This calculation is expressed as a percentage, representing how far the current price is from the previous day's low or high.
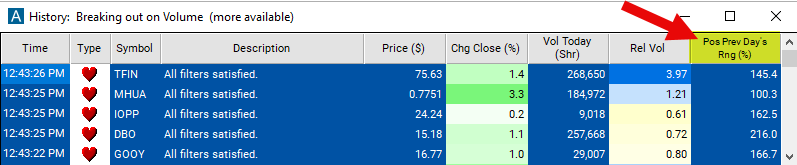
0 means that the last print was at the same price as the previous low. 100 means that the price of the last price was the same as the previous day’s high. 50 means that the last price was exactly in the middle of the previous day’s trading range. This number can be below 0 or above 100 when the last print is below the previous day’s low or above the previous day’s high.
Position in Previous Days Range Filter Settings
The settings of each Trade Ideas filter are defined in the Window Specific Filters Tab located in the Configuration Window of your Alert/Top List Window.
Here is how to setup the filter in your configuration window:
- Set the minimum filter to 100 and leave the max filter blank to see stocks trading near the previous day's high.
Using the Position in Previous Days Range Filter
Several trading strategies can be employed with the Position in Previous Days Range filter. Here are a few examples:
Reversal Trading: Contrarian traders may look for stocks that have moved significantly away from the previous day's range, indicating overbought or oversold conditions. If the price shows signs of reversal near the high or low of the previous day's range, such as bearish or bullish candlestick patterns, traders may enter positions anticipating a reversal back toward the mean.
Range Trading: Traders may identify stocks that are trading within the previous day's range and look to capitalize on price oscillations within that range. They may enter long positions near the low of the previous day's range and short positions near the high, aiming to profit from price reversals back toward the mean.
Volatility Breakout: Traders may use the position in the previous day's range filter to identify periods of low volatility where the price remains within the previous day's range. When the price breaks out of this range, indicating a surge in volatility, traders may enter positions in the direction of the breakout, aiming to profit from the ensuing price movement.
FAQs
What does the "position in previous days range" filter indicate?
- This filter indicates the current position of a stock's price within the price range of the previous trading day. It helps traders assess the relative strength or weakness of the current price movement based on its position within the previous day's range.
How is the position in previous days range calculated?
- The position in previous days range is typically calculated as a percentage representing how far the current price is from the previous day's low or high. For example, a position of 50% indicates that the current price is halfway between the low and high of the previous day's range.
Can the "position in previous days range" filter be used for both long and short trading strategies?
- Yes, the filter can be used for both long and short trading strategies. Traders may assess the position of the price within the previous day's range to identify potential entry or exit points for long or short positions based on their trading strategy.
How should traders interpret the position in previous days range values?
- Traders may interpret higher position in previous days range values (closer to 100%) as indicating bullish momentum or buying pressure, while lower values (closer to 0%) may suggest bearish sentiment or selling pressure. The interpretation may vary based on the specific trading strategy and market conditions.
Filter Info for Position in Previous Day's Range [RPD]
- description = Position in Previous Day's Range
- keywords = Highs and Lows Single Print
- units = %
- format = 1
- toplistable = 1
- parent_code =