Volume Today
Table of Contents
- Understanding the Volume Today Percent Filter
- Volume Today Percent Filter Settings
- Using the Volume Today Percent Filter in Trading
- FAQs about Volume Today Percent
Understanding the Volume Today Percent Filter
The Volume Today % Filter offers an instantaneous snapshot of a stock’s volume for the current day, expressed as a percentage of its typical full-day trading volume.
The filter computes this percentage by comparing the number of shares traded today to the average number of shares the same stock usually trades over a complete day, based on data from the last 10 trading days. This provides a dynamic view of how the day's trading volume is shaping up relative to its usual activity.
One of the key features of the Volume Today % filter is its functionality during the premarket. Unlike some other volume-based filters, it begins its calculations at the start of the premarket session. As the trading day advances and more shares are traded, the filter's percentage reading increases. This is because the current day's volume is expanding while the 10-day average full-day volume remains the same.
This Volume Today % Filter is very similar to the Strong Volume Alert, but it gives more precise control over the volume range you're interested in. For instance, you can filter for stocks that are trading between 195% and 202.65% of their normal volume.
The Strong Volume Alert will provide similar results if you look for stocks with a ratio of 2.
While the Volume Today % filter is simple and useful for certain strategies, it's important to note that it doesn't consider the specific time of day or the nuanced fluctuations in volume that might occur during the trading day. If you're seeking more advanced filtering, other tools, for example the Relative Volume Filter, might be more suitable. Daily volume filters can limit your focus to stocks that usually trade in high or low volumes, while current volume filters can show you stocks that are trading significantly more or less than usual on the current day.
Keep in mind that the Volume Today % filter will need manual adjustments over time if you're using it to track specific volume thresholds. This is because the trading volumes for stocks tend to increase as the day progresses. Therefore, the percentage thresholds you set in the morning may not be as relevant later in the day.
In summary, the Volume Today % filter is a robust tool for capturing a quick snapshot of a stock's trading activity for the day, especially when you're interested in significant deviations from its typical trading volume.
Volume Today Percent Filter Settings
Activating the Volume Today % Filter is straightforward. You'll find its settings under the Window Specific Filters Tab in your Alert/Top List Window's Configuration Window. You can set a minimum and/or maximum value, and stocks that don't fit within your parameters are automatically excluded from your scan results.
-
To find stocks that are trading at 150% of their average volume, add the Volume Today % Filter to your scan and enter 150 in the minimum field in the Windows Specific Filters Tab.
-
To find stocks that are trading at lower than average volumes, add the Volume Today % Filter to your scan and enter 99 in the maximum field in the Windows Specific Filters Tab.
Using the Volume Today Percent Filter in Trading
The Volume Today % Filter is a versatile tool that can support various trading strategies. By providing a snapshot of a stock's trading volume relative to its typical volume, it can help you spot unusual activity, identify potential breakouts, and make more informed trading decisions. As with any tool, it's most effective when used as part of a broader trading strategy, in combination with other technical indicators, and always alongside proper risk management.
Here's how traders can use the Volume Today Percent Filter effectively in trading:
-
Identifying Breakout Stocks: High trading volume often precedes a stock's price breakout. For instance, if a stock typically trades 100,000 shares per day, but at midday the Volume Today % Filter shows it's already traded 200,000 shares (200% of its typical volume), it's a strong signal that there's unusual interest in the stock. This can often indicate an impending price breakout. Traders can leverage this information to position themselves to take advantage of the anticipated price movement.
-
Spotting Overbought or Oversold Conditions: High volume can also suggest a stock is overbought or oversold. If the Volume Today % Filter shows a stock is trading at 300% of its average volume and its price has significantly increased or decreased, it might be overbought or oversold, respectively. Investors often use this information to time their buy or sell orders.
-
Contrarian Trading: Some traders use the Volume Today % Filter for contrarian trading. For example, if a stock's volume is unusually high but its price is dropping, a contrarian might interpret this as a sign that the selling is overdone and the price is due for a rebound. In this case, they might buy the stock.
-
Finding Quiet Movers: A trader might use the Volume Today % Filter to find stocks that are moving on lower than usual volume. For example, setting the filter's maximum value to 80% could help identify stocks that are quietly moving up or down, potentially ahead of a bigger move. These quiet movers often fly under the radar, giving traders an opportunity to get in early before the majority of market participants catch on.
-
Using in Combination with Other Indicators: The Volume Today % Filter can be even more effective when used in conjunction with other trading indicators. For example, a trader might combine it with a Moving Average Convergence Divergence (MACD) crossover to confirm a bullish signal or with a Relative Strength Index (RSI) to identify overbought or oversold conditions.
Consider stock XYZ, which typically trades 500,000 shares a day. You notice that by 11 am, the Volume Today % Filter shows it has already traded 750,000 shares, or 150% of its usual volume. On investigating further, you also see that XYZ has just crossed above its 50-day moving average, a bullish technical signal. You could interpret the combination of high volume and the technical breakout as a strong buy signal, and decide to go long on XYZ.
FAQs about Volume Today Percent
How quickly does the Volume Today % Filter update?
The Volume Today % Filter updates in real time throughout the trading day. As soon as a share is traded, it gets factored into the volume for the day, and the filter's percentage adjusts accordingly.
Can the Volume Today % Filter be used for all types of stocks?
Yes, the Volume Today % Filter can be used for any stock. However, it might be less reliable for stocks with extremely low average volumes or for newly-listed stocks with less than 10 trading days of history.
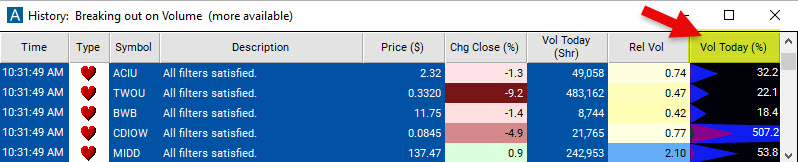
What is the meaning of the different colored triangles or cones inside the Volume Today % Filter Column?
This graphical representation of the Volume Today % filter is meant to be a helpful visual aid to quickly estimate the relative volume of a stock at a glance.
The Volume Today % filter column at most contains three different colored triangles or cones:
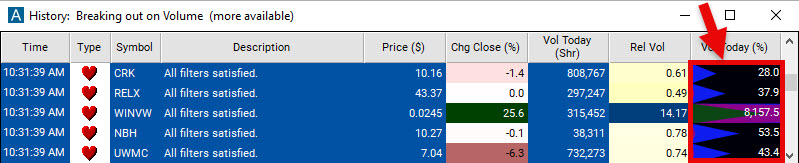
- Blue Triangle: This represents volume that's up to 100% of the normal volume. When the blue triangle fills the column from left to right, it signifies that the stock has traded an amount equal to its average volume over the last 10 trading days.
- Magenta Triangle: This represents volume from 100% to 1000% (or 1x to 10x) of the normal volume. If the stock has traded more than its average 10-day volume but less than ten times that amount, the magenta triangle will start filling up the column.
- Green Triangle: This represents volume that's above 1000% (or 10x) of the normal volume, up to a maximum of 10000% (or 100x). When the volume of shares traded surpasses ten times the average volume over the last 10 trading days, the green triangle starts to fill.
The idea is that by quickly looking at these triangles and their size, you can get an intuitive feel for how much a stock's current day volume compares to its average volume.
However, for exact numbers, they are also printed in the column. For example, if you see a value of '1242.0', this means the stock's current day volume is 1242.0% of its 10-day average volume. Even if the green triangle is only slightly visible, the numerical value gives the exact measure.
Similarly, a value like '78.5', which is less than 100, means that the stock's volume is 78.5% of the average volume, and you would see that the blue triangle hasn't filled the entire column and the magenta triangle is barely visible.
Whether you prefer a quick visual representation or exact numbers, the Volume Today % filter provides the information you need to understand a stock's relative volume.
I prefer a cleaner look, can I remove the graphics and only display the percentage value in the Volume Today % Column without any triangles or colors?
The preset filter is not customizable this way, but you can easily create a custom filter using the code [PV] via our Formula Editor. You can define the number of decimals that are displayed in this custom Today's Volume in % Column as well as if it uses graphical representation or not.
How can I adjust the Volume Today % Filter for stocks with different average volumes?
You don't need to adjust the filter for stocks with different average volumes, as it's a relative measure. It expresses each stock's volume as a percentage of its own average, so it automatically adjusts for stocks of different sizes and liquidity levels.
How should I interpret a low percentage on the Volume Today % Filter?
A low percentage reading on the Volume Today % Filter might suggest that a stock is trading unusually lightly for the day. This could indicate a lack of interest from traders, or it could mean that the stock is quietly building up for a bigger move. For instance, if stock XYZ typically trades 2 million shares a day, but by 3 pm it's only traded 1 million shares (50% of its usual volume), it could be a sign that traders are holding off in anticipation of some news or event.
Should I adjust my Volume Today % Filter thresholds throughout the day?
Yes, it can be beneficial to adjust your thresholds as the day progresses. This is because trading volumes tend to increase throughout the day. For instance, you might start the day with a minimum threshold of 50%, but raise it to 100% or higher by the afternoon to keep your scan results relevant.
Should I adjust my Volume Today % thresholds depending on market conditions?
Market conditions can certainly affect volume levels. For example, volume is often lower in the summer months and around holidays when many traders are away. During these times, you might want to lower your thresholds for the Volume Today % Filter. Conversely, during periods of high market volatility, you might want to raise your thresholds.
The Volume Today % Filter does compare today's volume to the average volume over the last 10 trading days, which helps to mitigate the impact of short-term fluctuations and seasonality. That being said, in more extended periods of different market conditions, such as the quieter summer months or the typically more volatile autumn months, the 10-day average volume itself may be affected by these factors. So while the impact is less direct and immediate, the thresholds you set for the Volume Today % Filter could still be influenced by these seasonal or periodical market conditions.
However, it's important to stress that the impact of such adjustments would likely be minor and would depend on the specifics of your trading strategy and the assets you're trading. For many traders, keeping consistent thresholds throughout the year would work just fine.
In conclusion, while the Volume Today % Filter does a good job of reducing the impact of short-term volume fluctuations, very careful traders might still want to consider longer-term changes in market conditions when setting their thresholds. This is more a point of refinement rather than a necessity.
Does a high percentage in the Volume Today % Filter always indicate a buy signal?
Not necessarily. While a high volume often precedes significant price moves, it's essential to analyze the context. For instance, high volume alongside a falling price could indicate strong selling pressure, which is a bearish signal. Always corroborate volume signals with other technical or fundamental indicators before making a decision.
Is the Volume Today % Filter useful for both day traders and swing traders?
Yes, the filter can be useful for both types of traders. Day traders may use it to identify stocks with unusual volume for intraday trades. Swing traders might use it to spot stocks showing consistent high-volume days, which could signal a longer-term trend.
How does the Volume Today % Filter behave on days with market-wide high volume, such as during major news events?
On days with significant news events, volumes might spike for many stocks. However, since the Volume Today % Filter is a relative measure, it can still help you identify which stocks are experiencing volume increases above and beyond the market-wide effect.
What's the relationship between the Volume Today % Filter and liquidity?
Higher volume usually corresponds to greater liquidity, meaning it's easier to buy or sell the stock without affecting its price. So, a high percentage on the Volume Today % Filter generally indicates high liquidity for that stock.
How reliable is the Volume Today % Filter for predicting price movements?
While the Volume Today % Filter is a useful tool, it's not foolproof. It should be used in combination with other indicators and analysis methods. Also, it's important to remember that it only provides a snapshot of current volume and doesn't take into account the specific time of day or nuanced fluctuations in volume throughout the trading day.
How can I compare Today's Volume to Yesterday's Volume, and what would be the differences between this comparison and the Volume Today % Filter comparison?
Comparing Today's Volume [TV] to Yesterday's Volume volume_p can be done using a simple ratio. The formula you would enter into our Formula Editor would be ([TV] / volume_p - 1) * 100
This gives the change in today's volume compared to yesterday's, expressed as a percentage. If the result is positive, today's volume is higher than yesterday's, while if it's negative, today's volume is lower. A result of +50% means that today's volume is 50% higher than yesterday's, while a result of -20% means that today's volume is 20% lower.
This comparison is different from the Volume Today % Filter in several ways:
- Timeframe: The Volume Today % Filter compares today's volume to the average volume over the last 10 trading days. This can smooth out daily fluctuations and give a more stable measure of typical volume. In contrast, comparing today's volume to yesterday's can be more volatile, as it's affected by any unusual events or fluctuations that occurred yesterday.
- Relevance: Depending on your trading strategy, either comparison could be more relevant. If you're interested in sudden changes in volume, comparing today's volume to yesterday's might be more useful. On the other hand, if you're more interested in whether today's volume is high or low compared to a typical day, the Volume Today % Filter might be more appropriate.
- Sensitivity to outliers: The Volume Today % Filter, by using a 10-day average, is less sensitive to outliers. If yesterday's volume was exceptionally high or low due to a one-off event, this won't greatly affect the 10-day average. However, it will have a big effect on the comparison between today's volume and yesterday's.
Both methods are useful and can complement each other. Comparing today's volume to yesterday's can give you immediate insight into how trading activity is changing, while the Volume Today % Filter can give you a more stable measure of whether volume is unusually high or low.
How can I use the Volume Today % Filter to identify potential reversal points?
A sudden increase in volume can sometimes signal a reversal point, especially when combined with other indicators. For example, if a stock has been declining but then has a day with high Volume Today % and a strong upward price move, this might indicate that the downtrend is reversing. Similarly, a high-volume day with a downward price move might indicate the end of an uptrend.
Filter Info for Volume Today [PV]
- description = Volume Today
- keywords =
- units = %
- format = 1
- toplistable = 1
- parent_code = TV