


Gap
Table of Contents
- Understanding the Gap in Percent Filter
- Gap in Percent Filter Settings
- Using Gap in Percent in Trading
- FAQs about Gap in Percent
Understanding the Gap in Percent Filter
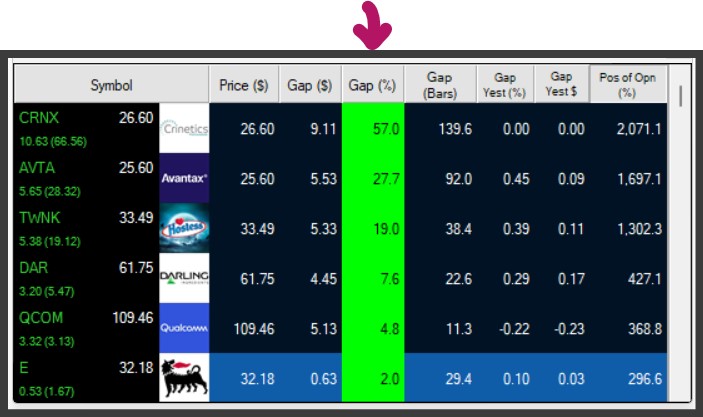
The Gap % Filter enables traders to identify stocks that have had significant movements in relation to their price, rather than just absolute dollar movements. This is especially useful when comparing stocks of different prices.
A $2 shift in a $10 stock isn't the same as a $2 gap in a $100 stock. While a Gap $ Filter would flag both stocks, the Gap % Filter would differentiate them, emphasizing the 20% change in the $10 stock over the mere 2% change in the $100 stock.
The formula for the Gap % calculation is (expected_open - last_price) / last_price * 100
expected_openrefers to today’s official open price, or the most recent print if the stock has not opened yet.last_priceis the official closing price from the previous day.
Depending on the trading session, the gap is therefore defined as follows:
During Market Hours
When the stock market is in session, the gap % represents the percentage difference between the open price and the previous day’s closing price.
Say, a stock closed at $100 the previous day and opens at $105 the next. It implies the stock gapped up 5%. Conversely, if a stock closed at $100 and opened at $98, it would mean the stock gapped down by 2% or, or in other words, gapped up -2%.
The official open price is the first price recorded once the trading day commences. While exchanges might adjust this, generally the open price, and subsequently the gap %, remain stable post the initial trade.
During the Premarket and Afterhours
Before the market opens at 9:30 am EST, the gap % is calculated by gauging the difference between the current stock price and the last official closing price. This offers a progressively accurate estimate of the day's potential gap.
Right after the closing bell at 4 pm EST, we can initiate this estimation. For instance, if a stock's last print today is $50 and the first after-hours print mirrors this at $50, it resets the gap to zero. However, if the next print is $51, it implies the stock has gapped up by 2%.
Do remember, for the first 90 seconds post market closing, the gap % for high-liquidity stocks may not be precise. The exchange needs this time to report the final trades of the day and shift into after-hours mode. For thinly traded stocks, the gap adjusts with the first after-hours print, irrespective of its timing.
Gap in Percent Filter Settings
Activating the Gap % Filter is straightforward. You'll find its settings under the Window Specific Filters Tab in your Alert/Top List Window's Configuration Window.
You can set a minimum and/or maximum value, and stocks that don't fit within your parameters are automatically excluded from your scan results.
-
To track stocks that gapped up by at least 5%, add the Gap % Filter to your scan and key in 5 in the minimum field in the Windows Specific Filters Tab.
-
To spot stocks with a gap up of no more than 2%, add the Gap % Filter Filter to your scan and enter 2 in the maximum field in the Windows Specific Filters Tab.
-
If you wish to pinpoint stocks with no gaps or only minor gaps, say within a 1% range, add the Gap % Filter Filter to your scan and enter -1 in the minimum field and 1 in the maximum field in the Windows Specific Filters Tab.
-
To discover stocks with a significant gap, either upwards or downwards, add the Gap % Filter Filter to your scan and enter 5 in the minimum field and -5 in the maximum field. This filters stocks with a gap in either direction of 5% or more.

Using Gap in Percent in Trading
Trading based on gap percentages can offer unique insights, as you're looking at relative movement instead of absolute dollar values. Here are some strategies grounded in the nuances of gap percentages:
- Relative Gap and Go Strategy: Especially useful for stocks with a smaller price tag. A 5% gap for a $10 stock is just $0.50, but it indicates a significant relative movement.
- Gap % Continuation: Ideal for traders eyeing multi-day momentum. For instance, if a stock witnessed a robust uptrend, closing the day 3% up and starts the next with another 4% gap, it's a positive momentum sign.
- Exhaustion Gap % Strategy: After prolonged bullish or bearish runs, a sizeable gap might signal an impending reversal. For a stock that's been bullish for a while, a sudden 7% gap might hint at the climax of buying.
- Breakaway Gap % Strategy: When a stock, post a period of consolidation, shows a significant gap, it's an indicator of a strong sentiment shift.
- Common Gap % Strategy: Daily fluctuations often lead to minor gaps. A 1-2% daily gap without significant news might revert, presenting trading opportunities.
- Island Reversal with Gap %: If a declining stock suddenly has a 5% gap down, trades in a tight range for some days, and then experiences a 6% gap up, it's a bullish reversal sign.
As always, understanding risk is paramount. While gap % provides an intriguing perspective, ensure protective measures like stop-loss orders are in place. Also, before you dive in, test out these strategies on historical data to understand their efficacy.
FAQs about Gap in Percent
How does the Gap % Filter help in comparing stocks of varying prices?
The Gap % Filter, by focusing on percentage rather than absolute value, levels the playing field when comparing stocks of different prices. For instance, a $1 movement on a $50 stock and a $10 movement on a $500 stock both represent a 2% gap. This relativity allows traders to compare momentum or volatility across stocks irrespective of their price.
How do I integrate the Gap % Filter with other technical indicators?
While the Gap % Filter provides insights into a stock's opening movement, integrating it with other technical indicators can enhance its efficacy. For instance, combining gap % with volume can validate the strength of a movement. Similarly, using the Gap % Filter with trend lines or moving averages can help traders discern potential continuation or reversal patterns.
How reliable is the Gap % Filter during major market disruptions?
During major market disruptions, such as crashes or booms, many stocks might experience significant gaps. In such scenarios, while the Gap % Filter can still provide insights, it's essential to interpret the data with caution. External factors and widespread panic or euphoria can lead to exaggerated gaps, which might not always represent sustainable movements.
How does market capitalization factor into the Gap % Filter's interpretation?
Market capitalization can influence a stock's liquidity and volatility. Generally, larger-cap stocks might have smaller gaps due to their stability and liquidity, while smaller-cap stocks might exhibit more pronounced gaps due to news or market sentiment. It's beneficial to factor in a company's market capitalization when interpreting the implications of its gap %.
When would I use the Gap $ Filter and when the Gap % Filter?
It's akin to choosing between a magnifying glass and a telescope. Both tools offer different perspectives.
Use the Gap $ Filter when you're trading in stocks that are more or less in the same price bracket. It provides an absolute measure, making it excellent for understanding the dollar value movement of stocks, especially if you're day trading and are looking for specific dollar fluctuations. It’s particularly beneficial when you're operating with a fixed trading size.
The Gap % Filter shines when you're comparing stocks across different price ranges. Percentage gaps level the playing field. A 5% gap on a $50 stock and a 5% gap on a $500 stock both indicate strong momentum or potential news-driven activity, even though the dollar gaps are $2.50 and $25, respectively. The Gap % Filter is your telescope, offering a wider view and allowing for relative comparisons. It’s also brilliant for swing trading, where relative price movements over multiple days can signal trend continuations or potential reversals.
Using both filters in tandem can be even more powerful. For example, setting up an alert for stocks that have both a dollar gap of over $2 and a percentage gap of over 4% can pinpoint stocks that are truly on the move, irrespective of their price.
How do we handle stocks with low liquidity while using the Gap % Filter?
Stocks with low liquidity can exhibit exaggerated gaps due to limited trading volume. Traders should approach such stocks with caution, verifying the gap's cause and ensuring they're not trading into a potential "trap."
How can one avoid false positives using the Gap % Filter?
Combining the Gap % Filter with other indicators, like volume, RSI, or MACD, can help validate a move and reduce false positives. Additionally, always look for corroborating news or events that might explain the gap.
Is the Gap % Filter useful for long-term investors, or is it mainly for short-term traders?
While predominantly a tool for short-term traders, long-term investors can also utilize the Gap % Filter to identify potential entry points. A significant gap on strong volume might indicate a change in market sentiment or the onset of a new trend that could be relevant for longer-term positions.
I've set my Gap % Filter to look for stocks that gapped up by 4% or more. I have 20 results. How do I prioritize which stocks to trade?
Prioritize by looking at:
-
Volume: Stocks with higher relative volume can indicate stronger interest and validation of the gap.
-
News: Quickly scan for any news releases that might explain the gap. Strong positive news can give you more confidence in the trade.
-
Support and Resistance Levels: If the stock gapped just above a major resistance, it might serve as a good bullish signal.
While using the Gap % Filter, I noticed a stock gapping up by 10%. But the volume is very low. Should I trade it?
Low volume on a significant gap can be a warning sign. Without substantial volume to support the move, the gap could quickly fill, leading to potential losses. Always consider volume alongside the gap.
I've observed a stock that gapped down by 3%. However, it has now moved up by 1.5% in the first hour. How can I use the Gap % Filter to trade this scenario?
This could be a potential "Gap Fill" strategy. The stock may be attempting to fill the gap it created at the open. You can consider a long position, targeting the previous day's close as a potential exit. Set a stop loss below its intraday low to protect your position.
How can I use the Gap % Filter in conjunction with moving averages?
Say you're looking for stocks that gapped up. You can further refine by checking if the stock is also trading above its 50-day or 200-day moving average. This can indicate that the stock is in an overall uptrend and the gap up might have a higher chance of sustaining.
The Gap % Filter shows a stock gapped up 7% with a huge spike in volume at the open but is now trading flat. How should I interpret this?
A large gap with high volume, followed by a consolidation phase, can be a setup for a "Continuation Play." Traders often wait for a breakout from this consolidation (either upwards or downwards) before taking a position.
Can I use the Gap % Filter to identify potential swing trades?
Yes! If a stock has gapped and sustained its levels for the day, it might indicate a continuation over the next few days. Combine this with other indicators like RSI or MACD to identify potential swing trade opportunities.
Filter Info for Gap [GUP]
- description = Gap
- keywords =
- units = %
- format = 1
- toplistable = 1
- parent_code = GUD