


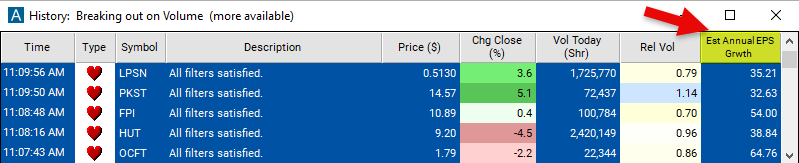
Estimated Annual EPS Growth
Table of Contents
- Understanding the Estimated Annual EPS Growth Filter
- Estimated Annual EPS Growth Filter Settings
- Using the Estimated Annual EPS Growth Filter
- FAQs
Understanding the Estimated Annual EPS Growth Filter
Estimated Annual EPS Growth is a ratio used to estimate the annual growth rate of a company's earnings per share (EPS). It compares the current quarterly data to that of 12 months ago. The ratio provides insight into the company's earnings growth trajectory over the past year, helping investors assess its performance and growth potential.
Calculation: The formula for Estimated Annual EPS Growth is: (current EPS estimate - year ago actual EPS) / current EPS estimate.
Interpretation: A positive Estimated Annual EPS Growth indicates that the current EPS estimate is higher than the EPS from the same period one year ago. This suggests potential earnings growth over the past year. A negative value indicates that the current EPS estimate is lower than the EPS from the same period one year ago, suggesting a decline in earnings over the past year. The magnitude of the ratio reflects the percentage change in EPS over the past year relative to the current EPS estimate.
Estimated Annual EPS Growth Filter Settings
Configuring the "Estimated Annual EPS Growth" filter is simple and can be done within the Window Specific Filters Tab of the Configuration Window in your Alert/Top List Window.
Here's how to set up the filter in your configuration window:
- Set the minimum value to 25 to see only stocks where the estimated quarterly earnings are up at least 25% from last year.
Using the Estimated Annual EPS Growth Filter
The "Estimated Annual EPS Growth" filter can be used in various trading strategies, including:
Growth Investing: Focus on companies with high Estimated Annual Growth Rates, indicating strong earnings growth potential. Invest in companies with consistent and sustainable growth rates that outpace industry averages or market expectations. Look for companies with accelerating growth rates compared to historical trends, signaling increasing momentum.
Momentum Trading: Trade based on the momentum of companies with high Estimated Annual Growth Rates. Take long positions in stocks that exhibit positive earnings momentum, indicating growing investor confidence and potential for further price appreciation. Utilize technical analysis tools to identify trends and entry/exit points for trades.
Contrarian Strategy: Identify companies with low Estimated Annual Growth Rates relative to their peers or historical averages. Evaluate whether the market may be underestimating their growth potential, leading to potential buying opportunities. Take contrarian positions in stocks with favorable long-term prospects but temporarily depressed growth expectations.
FAQs
How do I interpret changes in Estimated Annual Growth Rates?
- Increasing EAGR suggests improving growth prospects and may indicate a positive outlook for the company. Decreasing EAGR may signal challenges or changing market conditions affecting the company's growth potential.
What is considered a high or low Estimated Annual Growth Rate?
- The definition of high or low EAGR can vary depending on industry norms, company size, and market expectations. Generally, a double-digit percentage growth rate may be considered high, while single-digit or negative growth rates may be considered low.
How is EAGR calculated?
- Estimated Annual Growth Rate is calculated using the formula: (current EPS estimate - year ago actual EPS) / current EPS estimate.
Filter Info for Estimated Annual EPS Growth [EstAEPSG]
- description = Estimated Annual EPS Growth
- keywords = Fundamentals Changes Daily
- units = Ratio
- format = 2
- toplistable = 1
- parent_code =