


Average True Range
Table of Contents
- Understanding the Average True Range Filter
- Average True Range Filter Settings
- Using the Average True Range in Trading
- FAQs about Average True Range
Understanding the Average True Range Filter
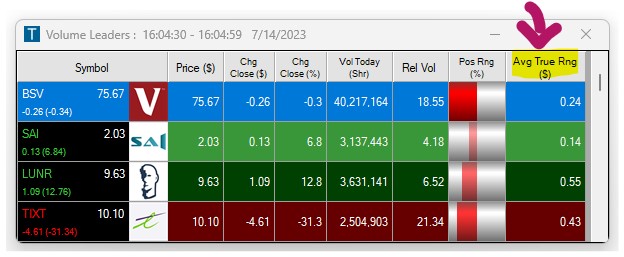
The Average True Range (ATR) is a technical analysis indicator that measures market volatility.
Picture the Average True Range (ATR) like a thermometer for the stock market's mood swings. It won't tell you which way the market's headed, but it gives you a feel for how temperamental it's being.
Firstly, it measures what's known as the 'True Range.' This is essentially the most significant movement a stock has had during a trading day. It looks at three things: the difference between the day's high and low prices, the difference between the previous day's closing price and the current day's high, or the difference between the previous day's closing and the current day's low, to determine what's the most significant single-day change in this stock's price.
After working out the 'True Range' for a day, the ATR calculation then smoothens these figures over the last 14 trading days. It's not just a straight-up average; instead, it leans more heavily on the recent movements.
Average True Range Filter Settings
Activating the Average True Range Filter is straightforward. You'll find its settings under the Window Specific Filters Tab in your Alert/Top List Window's Configuration Window.
You can set a minimum and/or maximum value, and stocks that don't fit within your parameters are automatically excluded from your scan results.
-
To find stocks with an ATR of at least $2.49, add the Average True Range Filter to your scan and enter 2.49 in the minimum field in the Windows Specific Filters Tab.
-
To find stocks with an ATR of no more than $4, add the Average True Range Filter to your scan and enter 4 in the maximum field in the Windows Specific Filters Tab.
-
To find stocks with an ATR between $1 and $3, add the Average True Range Filter to your scan and enter 1 in the minimum field and 3 in the maximum field in the Windows Specific Filters Tab.

Using the Average True Range in Trading
Traders use ATR in several ways, it's like having a measure of the stock's mood, offering a better understanding of what they're dealing with.
- Setting stop losses: Many traders use the ATR to determine where to set their stop-loss orders. The idea is to set the stop-loss an ATR or some fraction of an ATR away from the entry point. This allows the price some room to move, but not so much that a major loss will occur if the price moves in the wrong direction.
- Market volatility: A higher ATR indicates a more volatile market, while a lower ATR suggests a less volatile market. This can help traders determine if it's a good time to enter or exit a trade. In a more volatile market, for example, a trader may choose to trade a smaller position to mitigate risk.
- Price breakout: Some traders use ATR to confirm price breakouts. The logic is that a significant price move accompanied by a high ATR is a stronger signal.
The ATR is a very useful tool, but it should be used in conjunction with other indicators and not used alone to make trading decisions. It provides a useful way to quantify the amount of price movement, but it doesn't tell you which direction the price will move.
FAQs about Average True Range
Can I adjust the ATR period?
Our Average True Range uses the standard of 14-periods. At this point, this time frame cannot be modified or customized.
Is there a way to incorporate a percentage-based Average True Range (ATR) metric?
You can easily create a custom filter to display or filter based on the Average True Range of a stock in %. To do so, enter the following formula in our Formula Editor:
[ATR]/price * 100
This formula provides a measure of volatility in terms of the percentage of the current stock price. This allows you to track volatility dynamically through the trading day.
The ATR % Filter is especially useful for comparing volatility across different stocks, as it adjusts for the fact that a $1 ATR means something different for a $10 stock than for a $100 stock.
A higher percentage implies more volatility, and a lower percentage implies less volatility.
What are the best ways to use ATR in conjunction with other technical indicators?
The ATR is often used in conjunction with other technical analysis indicators. For example, one popular approach is to use ATR in conjunction with a trend indicator, like a moving average. The idea is that the trend indicator can signal the direction of the trend, while the ATR can provide additional information about the volatility of that trend.
How does ATR adjust to the changing market conditions?
The ATR adjusts to changing market conditions by incorporating recent price data into its calculations. Since it's a rolling measure of the true range over a specified period, the most recent data points have a more significant impact on its value. If the market becomes more volatile, this will be reflected in larger true range values, which will then increase the ATR.
Can you give a specific example of how to use ATR when placing a stop?
A trader could, for instance, use ATR to set a stop loss at 2 times the ATR value below their entry point. So, if the Average True Range was 1.5 and they bought a stock at $100, their stop loss would be at $97 ($100 - 2*$1.5). This strategy could help a trader limit their losses while giving the trade enough room to move in their favor.
Can ATR help in setting profit targets?
Yes, some traders use the ATR to set profit targets as well as stop losses. For example, if a trader enters a long position, they might set a profit target at a multiple of the ATR above their entry point. This can help to ensure that potential profits are in line with the recent volatility of the market.
Is ATR effective for all types of trading, or does it perform better in certain strategies?
ATR is a versatile indicator that can be incorporated into various trading strategies. It is particularly effective in strategies that take market volatility into account. For example, traders who use a volatility stop – a stop level adjusted according to the asset's volatility – might find ATR useful since it provides a quantified measure of current volatility. However, as with any indicator, ATR's effectiveness ultimately depends on how it's used and how well it fits into the trader's overall strategy.
How do I know if the ATR of a stock is high or low?
To determine if an Average True Range value is high or low you can check the following:
- Price Level: To evaluate ATR you can look at it relative to the stock's price level, for example in terms of change from the open or its daily range. A $1 move for a $10 stock (10% of the price) is much more significant than a $1 move for a $200 stock (0.5% of the price). Thus, considering the ATR as a percentage of the stock's price can be useful. A high percentage could indicate high volatility relative to the price level, while a low percentage would indicate low volatility.
At Trade Ideas, we have two filters specifically designed for this purpose, you can see the Change from the Open as a % of the Average True Range, and you can also compare Today's Range of a stock to its Average True Range.
- Market Comparison: You can also compare the ATR of the stock you're analyzing to similar stocks in the market. If the ATR of your stock is much higher or lower than similar stocks, this might indicate higher or lower volatility, respectively.
- Consider Market Conditions: Finally, remember that market-wide conditions can influence ATR. During periods of overall market turmoil or volatility, ATR values might be high across the board.
A high or low ATR isn't inherently "good" or "bad"— it just indicates high or low volatility. What matters is how these levels of volatility fit into your trading strategy and risk tolerance.
Are there volatility indicators similar to ATR that give you a direction of where the stock is headed?
Volatility indicators are often used to assess the level of "fear" or "uncertainty" in a market, but they don't provide a specific directional bias. The Average True Range is a great example of this. It gives you an idea of how much price is moving, but not necessarily where it's going.
However, there are other technical indicators that combine volatility and directional information. Here are a few of them:
- Bollinger Bands: Bollinger Bands are a volatility and trend indicator. They consist of a moving average (middle band) and two outer bands that are standard deviations away from the moving average. The bands expand during periods of high volatility and contract during periods of low volatility. The price direction towards the bands can sometimes suggest the potential direction of the stock.
- Directional Indicator (DI): The DI is composed of two lines, the positive directional indicator (+DI) and the negative directional indicator (-DI). The +DI measures the strength of the upward trend while the -DI measures the strength of the downward trend. The direction in which these lines are moving can sometimes give a clue as to the future direction of the stock.
- Average Directional Index (ADX): ADX is often used with the DMI. It measures the strength of a trend but not its direction. However, the combination of ADX with +DI and -DI can provide a sense of direction.
- MACD (Moving Average Convergence Divergence): The MACD Indicator consists of the MACD line, signal line, and the histogram. The MACD line is the difference between a short-term and long-term moving average. When the MACD line crosses the signal line, it generates a trading signal. If the MACD line crosses above the signal line, it's a bullish signal, and if it crosses below, it's a bearish signal.
Indicators should not be used in isolation but in conjunction with other forms of analysis, like fundamental analysis or other technical indicators, to make more accurate predictions. And no indicator is perfect - they should be used as tools to aid decision-making, not as definitive predictors of market movements.
What is the difference between the Average Daily Range (ADR) and the Average True Range (ATR)?
The Average Daily Range (ADR) and the Average True Range (ATR) are both commonly used in trading to measure a stock's volatility, but they are calculated differently and can provide slightly different insights.
The Average Daily Range is calculated by determining the average difference between the high and low prices of a stock over a specific number of days. The ADR gives an average measure of the range in which a stock price moves in a single trading day, based solely on the high and low prices.
The Average True Range developed by J. Welles Wilder, is a more comprehensive measure of volatility. It factors in gaps in price that can occur between trading days, in addition to the regular high-low range.
In summary, while both the ADR and the ATR are useful for measuring volatility, the ATR provides a more comprehensive view because it considers the possible gap between the previous close and the current high or low. The ADR, on the other hand, only considers the high and low prices for a given trading day. Therefore, in markets with significant price gaps between trading sessions, the ATR may provide a more accurate measure of volatility.
Filter Info for Average True Range [ATR]
- description = Average True Range
- keywords = Changes Daily
- units = $
- format = p
- toplistable = 1
- parent_code =