Change From 5 Period SMA (2m)
Table of Contents
- Understanding the Change From 5 Period SMA 2m Filter
- Change From 5 Period SMA 2m Filter Settings
- Using the Change From 5 Period SMA 2m Filter
- FAQs
Understanding the Change From 5 Period SMA 2m Filter
The "Change From 5 Period SMA (2 minute)" filter in stock trading is used to compare the price of the last print for a stock to that of the 5 period simple moving average on a 2-minute chart. This filter is designed for short-term, intraday trading analysis due to its focus on small time increments and rapid SMA calculation. Here's how it's constructed and used:
Simple Moving Average (SMA)
5-Period SMA: This is an average of the stock's closing prices over the last 5 periods, where each period is 2 minutes long. In other words, it's the average closing price of the stock over the last 10 minutes of trading.
Dynamic Indicator: The 5-period SMA on a 2-minute chart is a highly dynamic indicator that changes quickly as new price data comes in every 2 minutes.
Calculation: The values entered for this filter are percentage (%). The formula is (Percent Change) = ((Last Price) - (SMA)) / (SMA) * 100.
A positive number means that the current price is above the moving average. A negative number means the current price is below the moving average.

Change From 5 Period SMA 2m Filter Settings
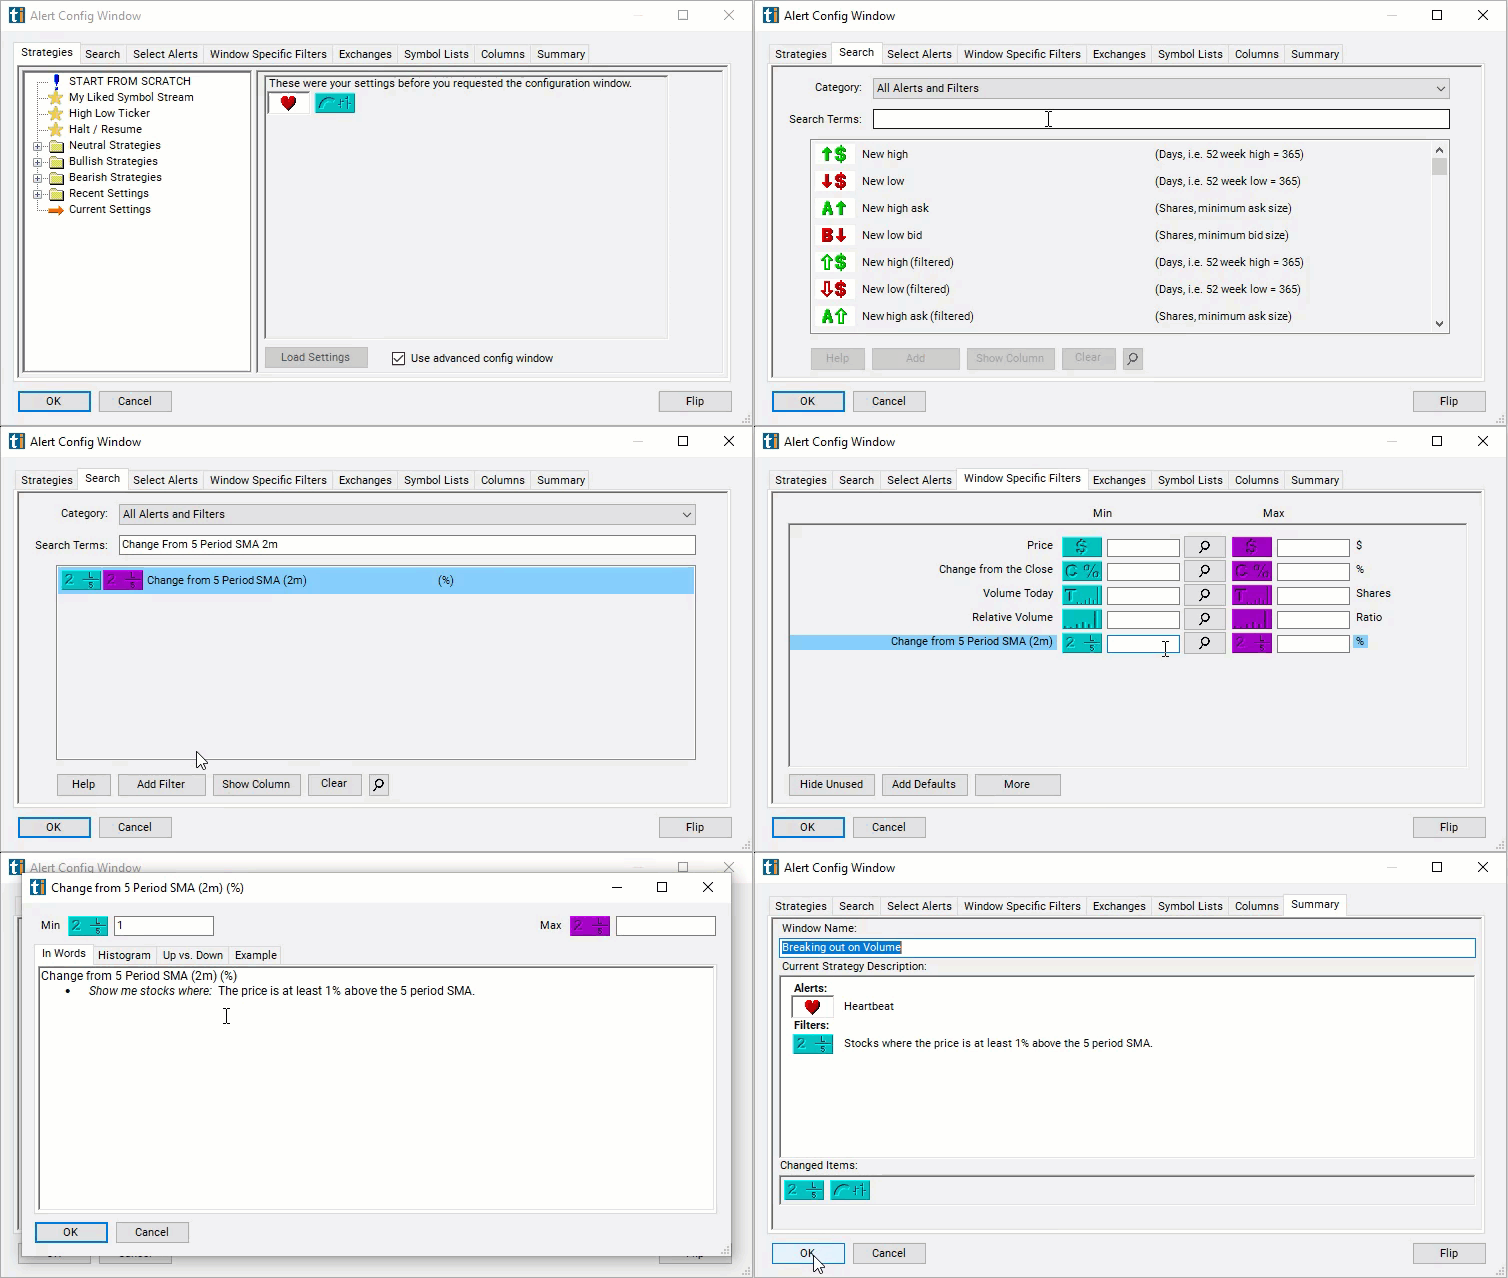
The settings of each Trade Ideas filter are defined in the Window Specific Filters Tab located in the Configuration Window of your Alert/Top List Window.
Here is how to setup the filter in your configuration window:
-
Set the min value to 1 to see only stocks in which the current price is above their 5 period SMA on a 2 minute chart.
-
Set the max value to -1 to see only stocks in which the current price is below their 5 period SMA on a 2 minute chart.

Using the Change From 5 Period SMA 2m Filter
Several trading strategies can be employed with the Change From 5 Period SMA 2m filter. Here are a few examples:
Intraday Trend Analysis: This filter is useful for day traders to identify the very short-term trend direction within the day.
Momentum Trades: Day traders might look for a significant positive change as a momentum entry signal or a significant negative change as a potential signal for a short trade.
Scalping: Traders employing a scalping strategy may use the filter to take quick, small profits from minor price changes, entering and exiting trades rapidly.
Pullback and Breakout Trades: Some traders look for moments when the price temporarily pulls back to the 5-period SMA during a larger uptrend as a buying opportunity, or when a price breaks well below the SMA during a downtrend to initiate a short position.
FAQs
What does a positive change from the 5-period SMA indicate?
- A positive change indicates that the stock price is currently trading above its 5-period SMA on a 2-minute chart, which could signal upward momentum or buying pressure in the very short term.
What does a negative change from the 5-period SMA suggest?
- A negative change suggests the stock price is trading below its 5-period SMA, potentially signaling downward momentum or selling pressure in the short term.
How significant should the change from the 5-period SMA be to consider a trade?
- This can depend on the volatility of the stock and market conditions. Traders often set thresholds based on historical volatility and their risk tolerance. Some may look for changes of more than a certain percentage to confirm a trading signal.
Is the "Change From 5 Period SMA (2 minute)" filter useful across all stocks?
- This filter can be applied to any stock, but its effectiveness may vary. Highly liquid stocks with substantial intraday volume tend to provide more reliable signals due to better price discovery. In contrast, stocks with low volume may exhibit erratic movements that can generate false signals.
Filter Info for Change From 5 Period SMA (2m) [2SmaLa5]
- description = Change from 5 Period SMA (2m)
- keywords = Fixed Time Frame Moving Average
- units = %
- format = 1
- toplistable = 1
- parent_code =


 Change from 5 Period SMA (5m) [5SmaLa5]
 Change from 5 Period SMA (15m) [15SmaLa5]